Trivariate Sea Ice Presence Map Products and Data Sets
Introduction:
Trivariate Sea Ice Presence map products and data sets are derived from the U.S. National Ice Center archive data to provide an accurate, comprehensive, and easily understood characterization of analyzed sea ice conditions in the polar regions. This new product leverages the whole daily ice record starting in 2007 to a period picked by the user to provide a nuanced diachronic view of ice type occurrence. It does this by mapping the occurrence of each of the three ice classifications used in the daily ice analysis directly onto the three additive color components. These components combine into unique colors which are then depicted in a variegated scheme. While exact values are preserved in the underlying data, the symbolization highlights the critical relative situational condition and allows an instant, accurate, overall comprehension of the ice conditions.
General Information:
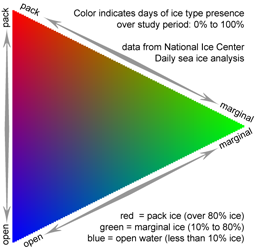
Trivariate Sea Ice Presence data, as displayed in the data products available on this site, is derived from NIC Daily Sea Ice analysis data. The NIC daily analysis generalizes ice conditions to three types: Pack Ice (over 80% ice coverage), the Marginal Ice Zone (MIZ) (10% to 80% ice coverage), and Open Water (less than 10% ice coverage).
Data for the indicated period is summarized to calculate the percentage of ice present per period in each 10 by 10 kilometer square cell, and each of the type percentages is mapped to a particular red, blue or green color component. The unique color created by that mapping indicates the conditions experienced in that cell over that period.
Pure red, green or blue, indicates that only pack, MIZ, or open water conditions were present, while purple shows where a rapid change between pack ice and open water (or vice-versa) occurred. Yellows show changes between pack and MIZ, and blue-greens between MIZ and open water. Browns indicate zones with about equal percentages of all three types.
The strength of this symbolization is the way it allows a clear depiction of the spatial and temporal variability, and how that variability has evolved.
Map and Data Availability:
Data sets of the Trivariate Sea Ice Presence data are not yet available for user download. If users require the Trivariate data sets in appropriate GIS compatible format(s) along with data symbolization information to facilitate the three color display, requests can be made directly to the NIC Command Duty Officer (CDO).
Identifying the Product:
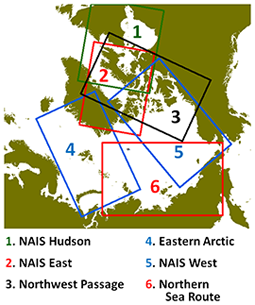
The analysis period for the standard information products distributed on this site is a half month: day 1 through 15 and day 16 through month's end. Files are identified by the date of the period start; for example: a file name beginning 2015_02_16_~ covers the period February 16, 2015 through February 28, 2015.
Files named with a date and a polar region. are for that time period in that year. (example: 2015_02_16_ARCTIC.kmz)
Files with the note "~_SINCE_2007" are compendiums of data for that period for every year from 2007 to the date of the file.
example: 2015_02_16_ARCTIC_SINCE_2007.kmz covers the second half of February of every year between 2007 and 2015, inclusive.
Single Year vs Compendium Year analysis:
Single Year data is comprised of the Daily Sea Ice data for the stated period for the single year named. Map products display the total number of days in that period, which can range from 12 days (for the second half of February (period 02_16) in a non-leap year) to 16 days (for the second half of any month with 31 days).
Compendium Year data is comprised of Daily Sea Ice data for the stated period for every year from 2007 to the year named. Map products display the total number of days in that period, which, for the first half (15 days) of January, for example, was, in 2013: 105 days, in 2014, 120 days, and in 2015: 135 days.
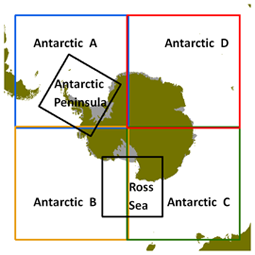
note: Marginal Ice in Antarctica was not tracked prior to January 23, 2010. This will affect all compendium results for Antarctica after that date.
Product Types:
KMZ format files cover the entire NIC polar analysis region. KMZ is a compressed version of Google Earth KML, and can be read directly by Google Earth and some other programs. A Google Earth legend for the data symbolization is available here .
note: this legend may not display in all versions of Google Earth.
PDF files are composed to print on standard US Letter (8 ½ x 11 inch) paper. Use Adobe Reader (free download) to view and print the files. Map extents for pdf format maps are the same as that used in the png format map of the same name.
PNG files are raster images sized to fit on digital presentation slides, such as PowerPoint, leaving extra screen space for notes or other content. They are also suitable for inclusion as illustrations in a document. Map extents for png format maps are the same as that used in the pdf format map of the same name.
Data Coordinate Information:
The Trivariate data was generated, and the maps were composed, in a commonly used Equal Area Azimuthal projection centered on the appropriate pole. The properties of this type of projection ensure that each square reporting cell has approximately the same area, although it may not have a square shape when plotted on the earth or in another coordinate system. The data is provided as vector polygon features, so data quality is less affected by re-projection than data in other formats. If you convert this data to a raster format, be aware that any subsequent coordinate conversion will cause data degradation.
Projection Parameters:
Name: North Pole Lambert Azimuthal Equal Area
WKID: 102017
Projection: Lambert Azimuthal Equal Area
False Easting: 0 meters
False Northing: 0 meters
Central Meridian: 0°
Latitude Of Origin: 90° (Arctic) or -90° (Antarctic)
Linear Unit: Meter
Datum: WGS 1984
Spheroid: WGS 1984
Semimajor Axis: 6378137 meters
Semiminor Axis: 6356752.314245179 meters
Inverse Flattening: 298.257223563 meters
Feedback:
Please direct comments, questions, and data requests concerning this product to the NIC CDO, mentioning Trivariate data in the message.
Keys: