Arctic Ice Products
The Arctic region is a main area for ice analysis by the U.S. National Ice Center. The Arctic is analyzed by concentration daily, with a more detailed analysis containing concentration and thickness completed weekly. Based off these analyses, numerous products are created and disseminated here. Periodic products like the Sea Routes and Outlooks are also placed here.
Area
Description
Display / Format
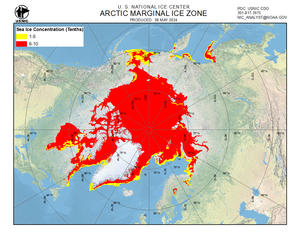
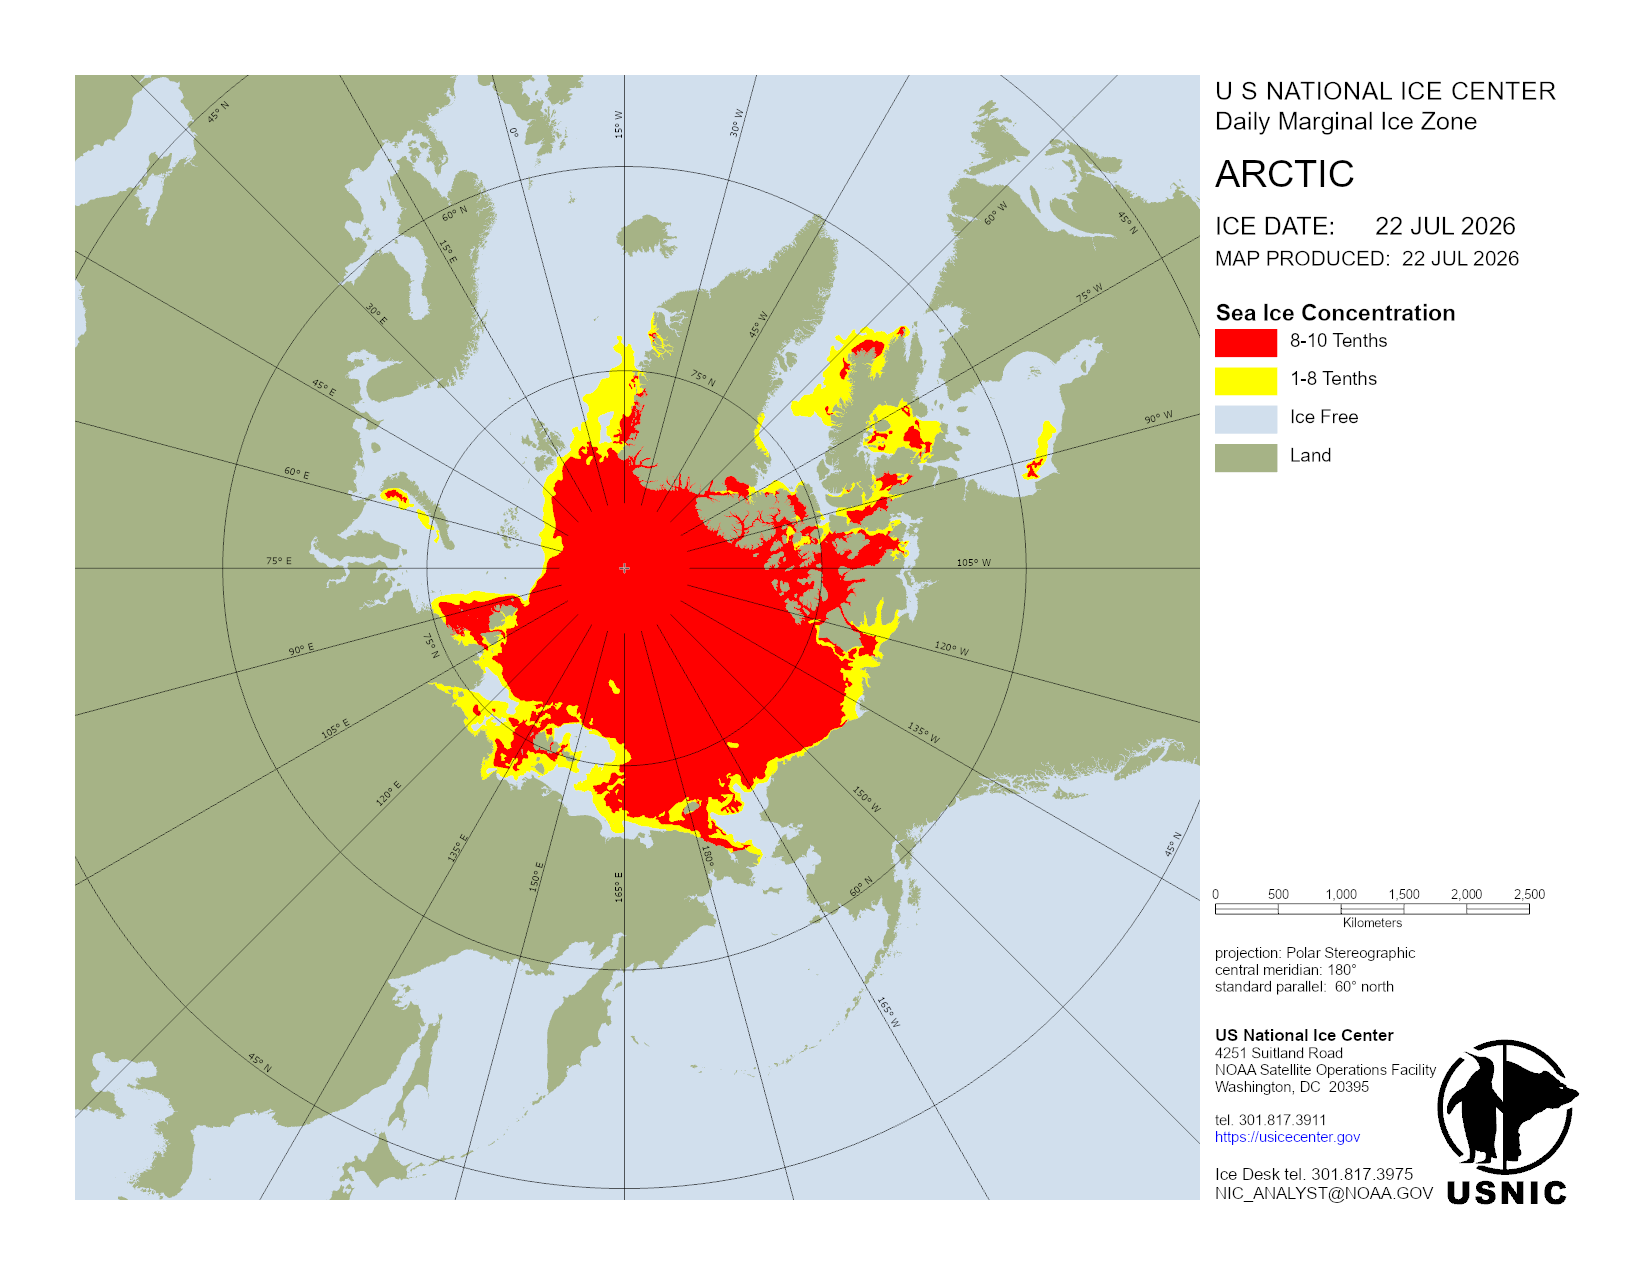
Daily Marginal Ice Zone
A graphical representation of the daily ice analysis that depicts the marginal ice zone (ice concentration up to 80%) in yellow and pack ice (ice concentration 80% and greater) in red.
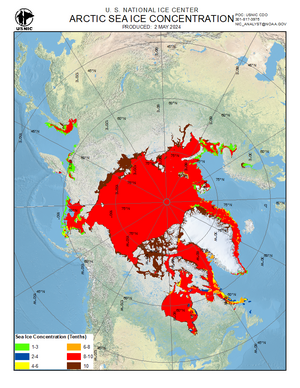
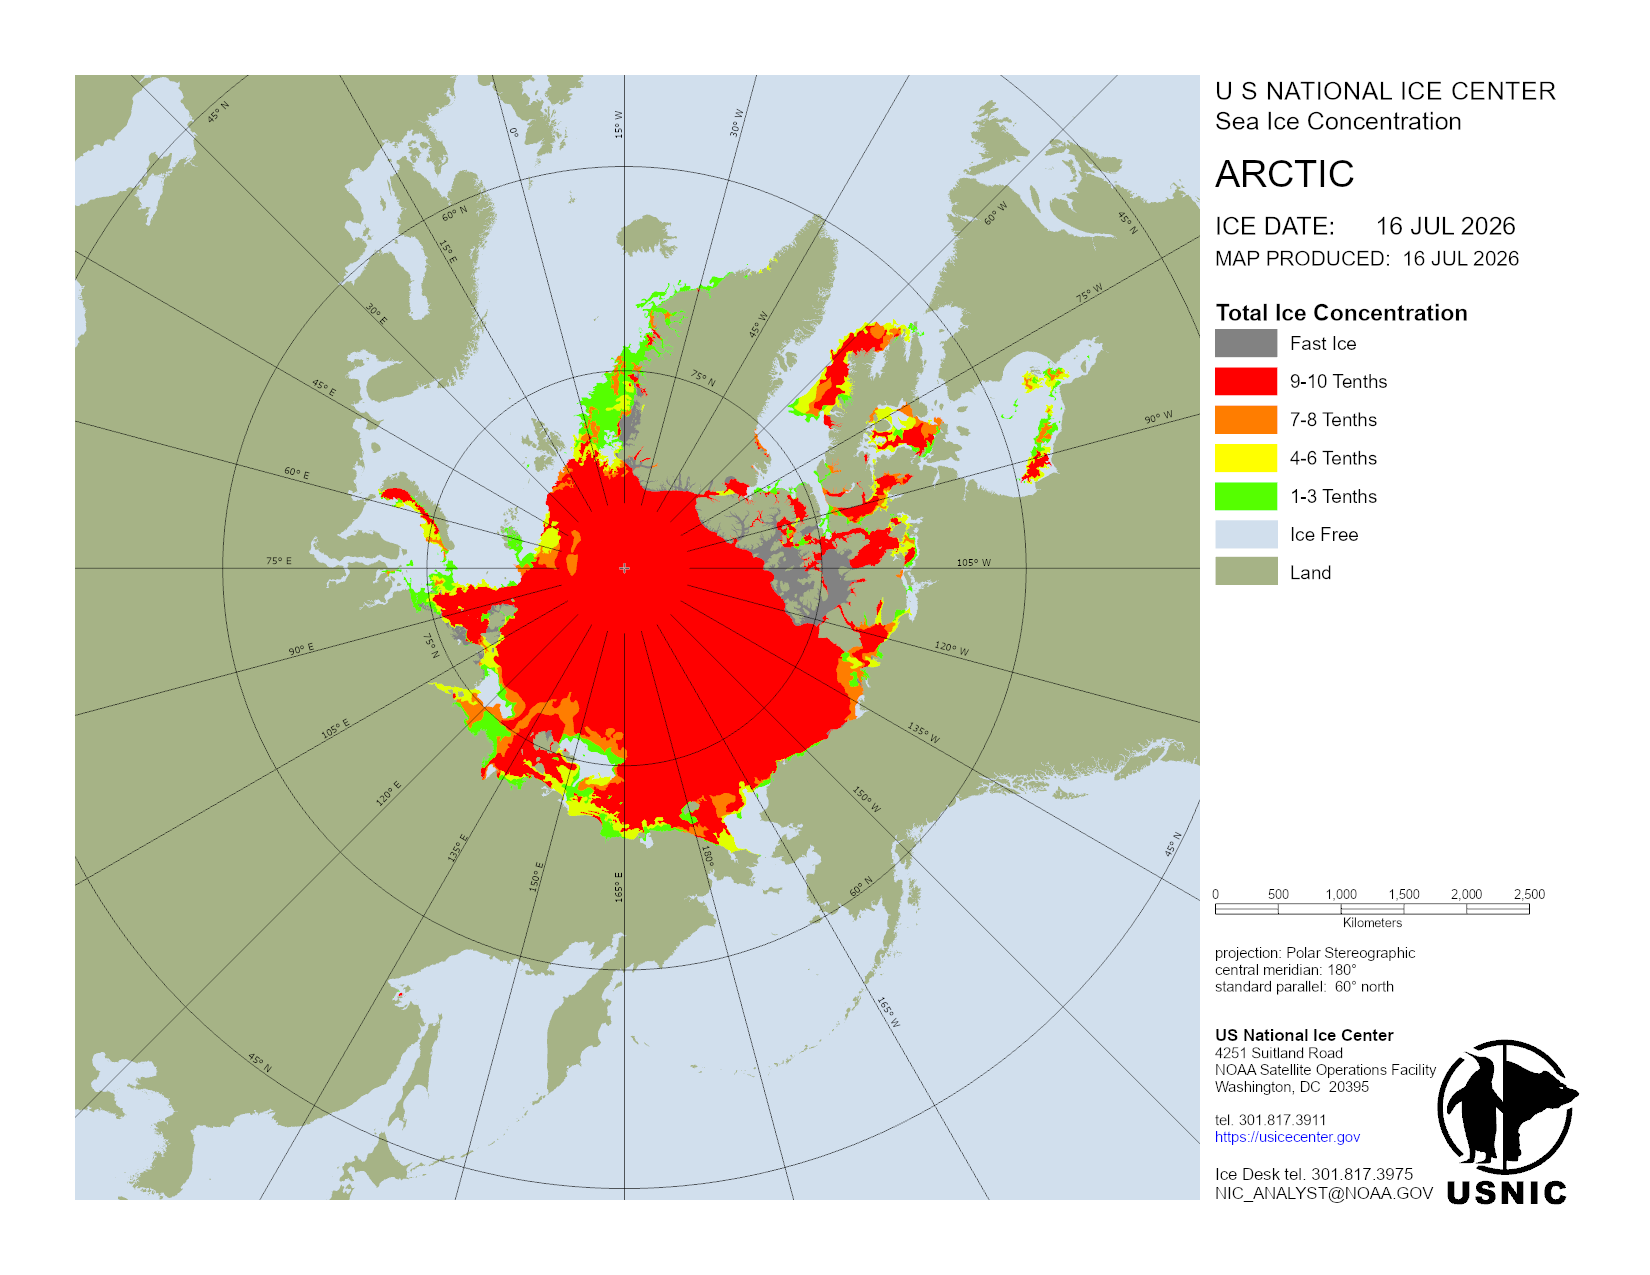
Weekly Ice Concentration
A graphical representation of ice concentrations based on the weekly ice analysis.
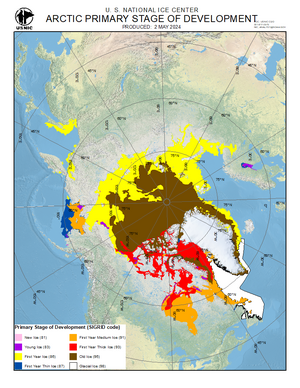
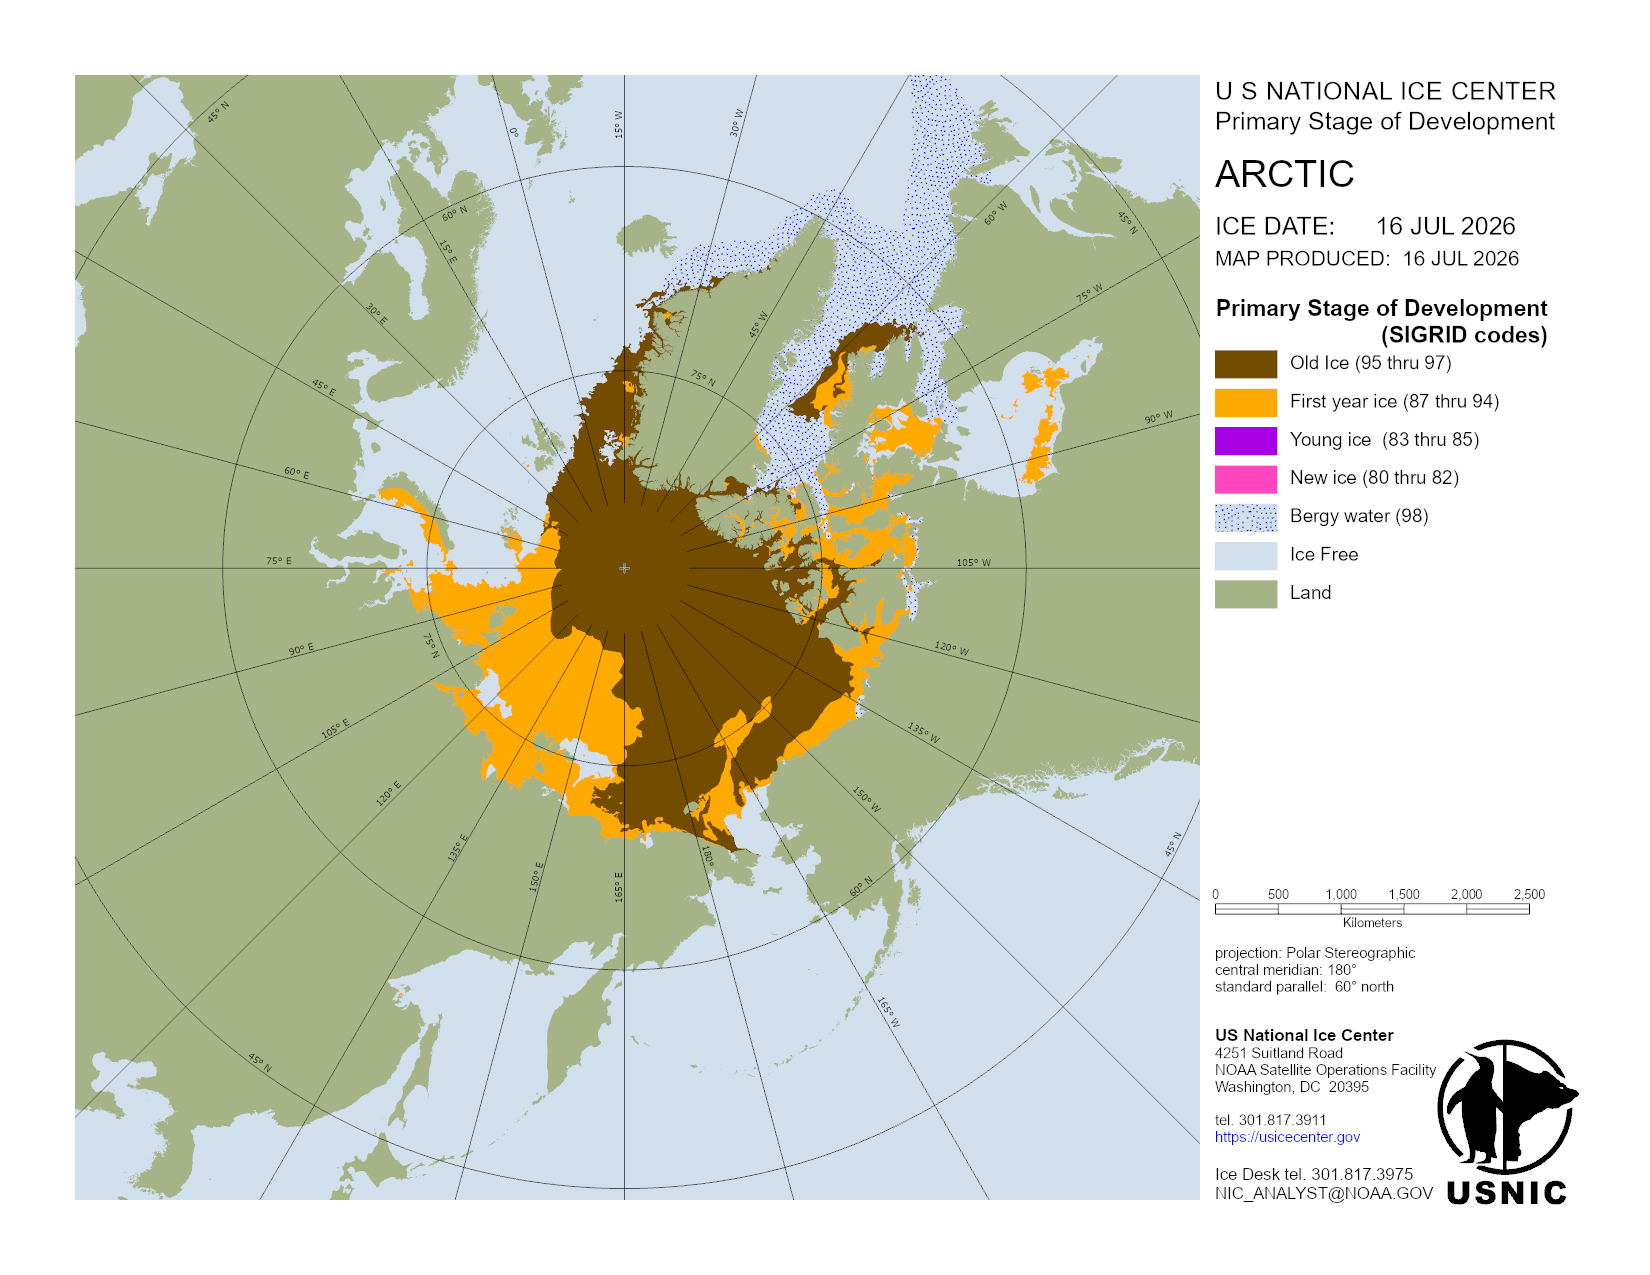
Weekly Stage of Development
A graphical representation of the estimated stage of development/ice thickness based on the weekly ice analysis.
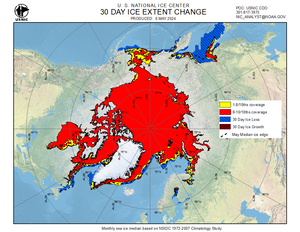
30-Day Ice Change
A graphical representation of the change in sea ice extent over the last 30 Days.
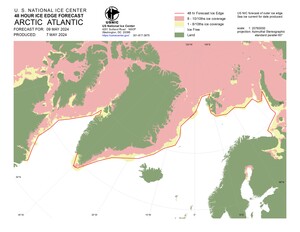
Arctic Daily Forecast Charts
A graphical representation of the daily ice analysis that depicts ice free in white, marginal ice zone (ice concentration up to 80%) in yellow, and pack ice (ice concentration 80% and greater) in pink. The graphic also displays the 48-hour forecast ice edge line. Both products are created to cover the entire Arctic based on region, Atlantic and Pacific.