Arctic Ice Charts
Based on U.S. National Ice Center's Arctic daily and weekly analyses, various ice charts are produced to represent ice conditions in a graphical format. Ice conditions are based on ice concentrations, stage of development (ice type / thickness), and 30 day ice concentration changes.
Area
Description
Display / Format
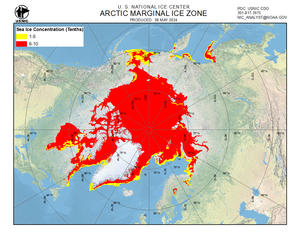
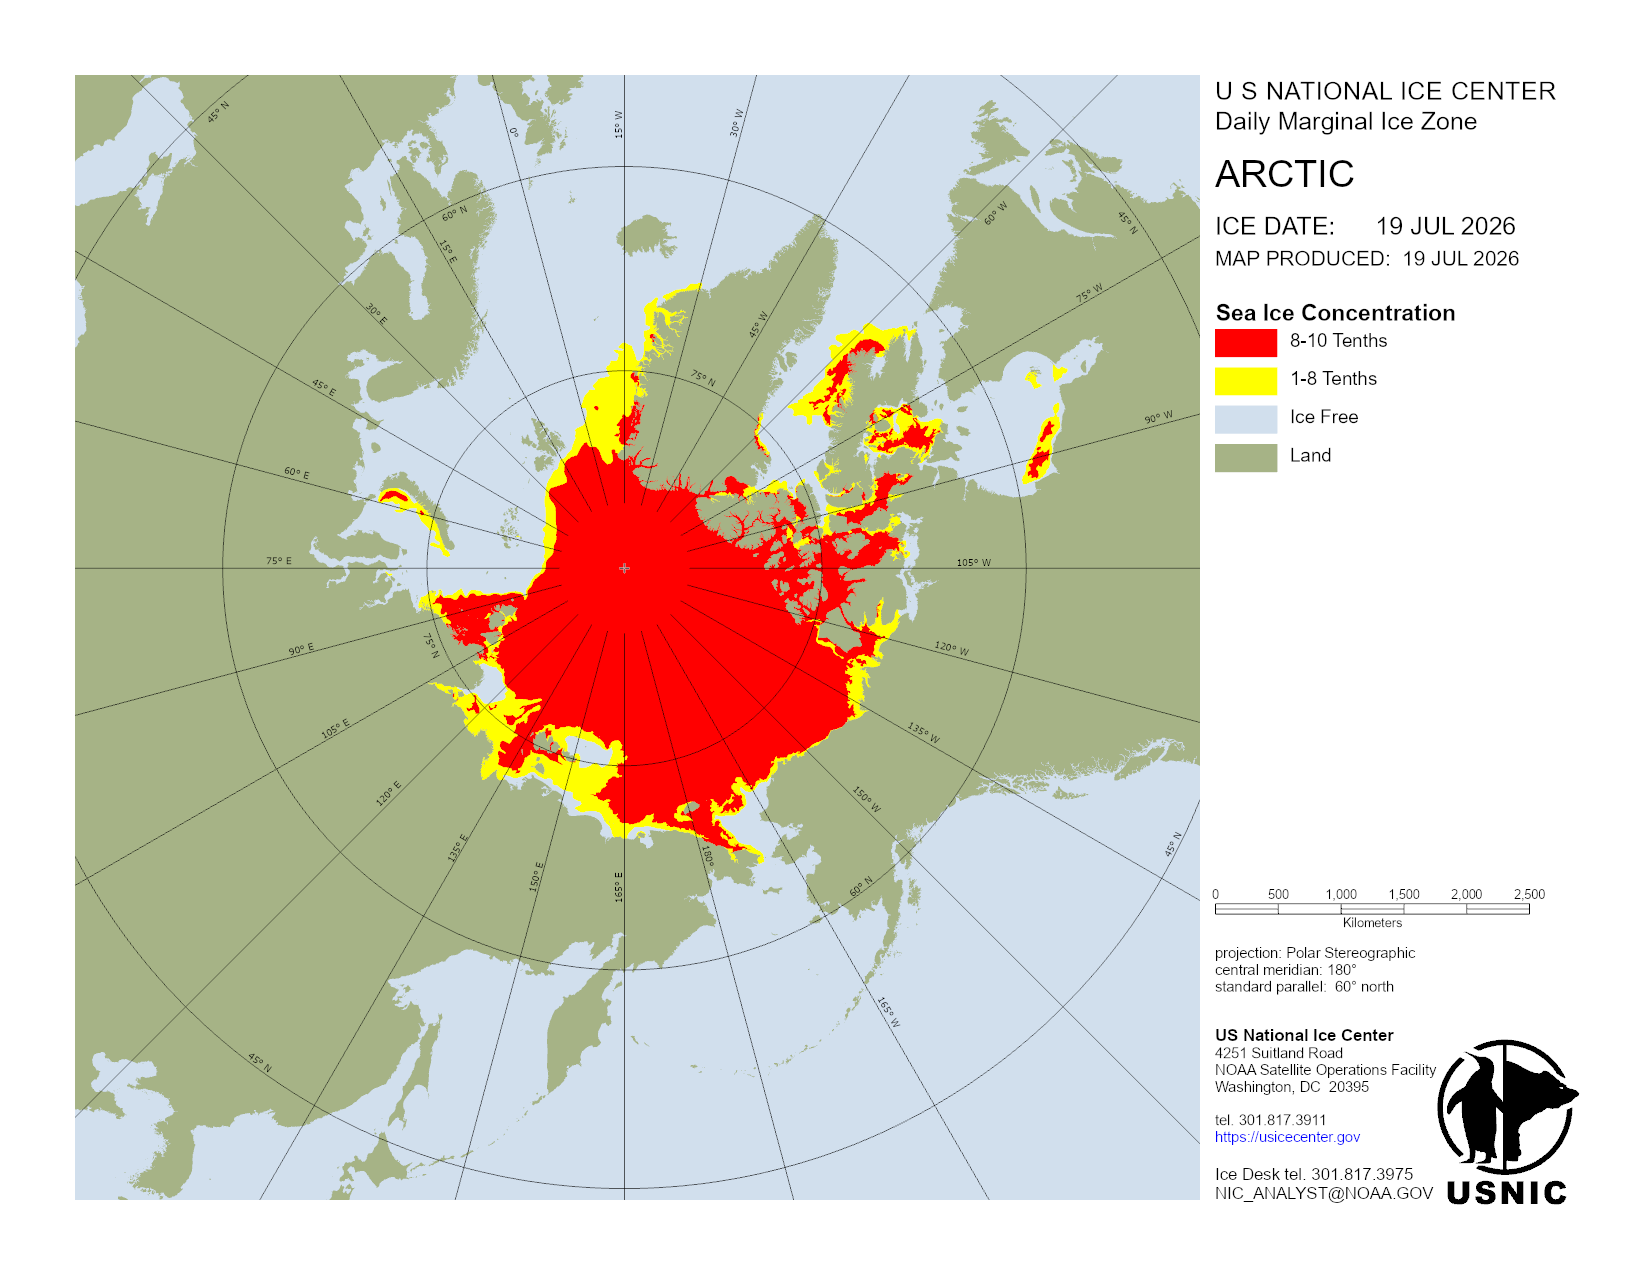
Daily Marginal Ice Zone
A graphical representation of the daily ice analysis that depicts the marginal ice zone (ice concentration up to 80%) in yellow and pack ice (ice concentration 80% and greater) in red.
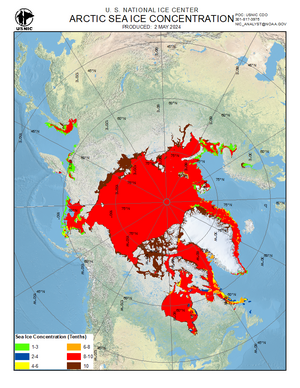
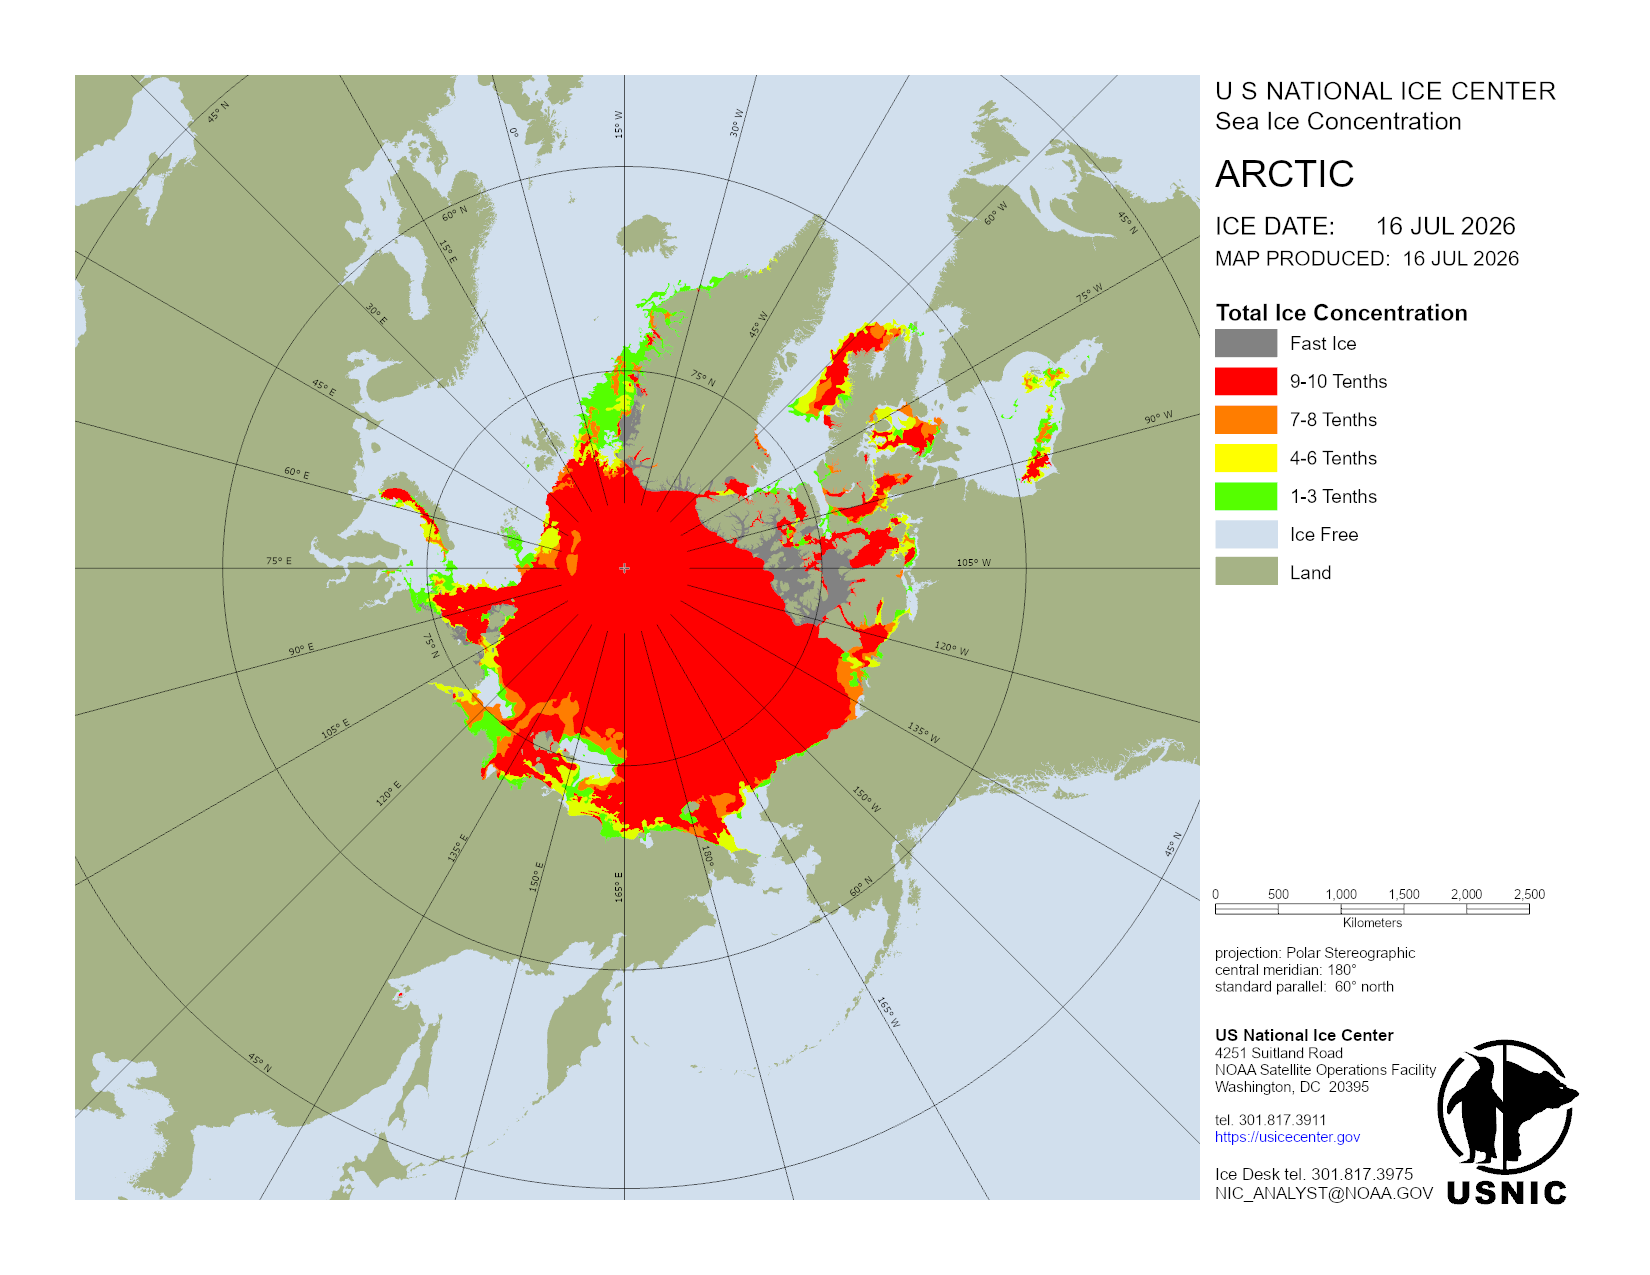
Weekly Ice Concentration
A graphical representation of ice concentrations based on the weekly ice analysis.
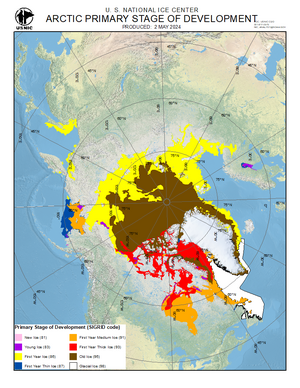
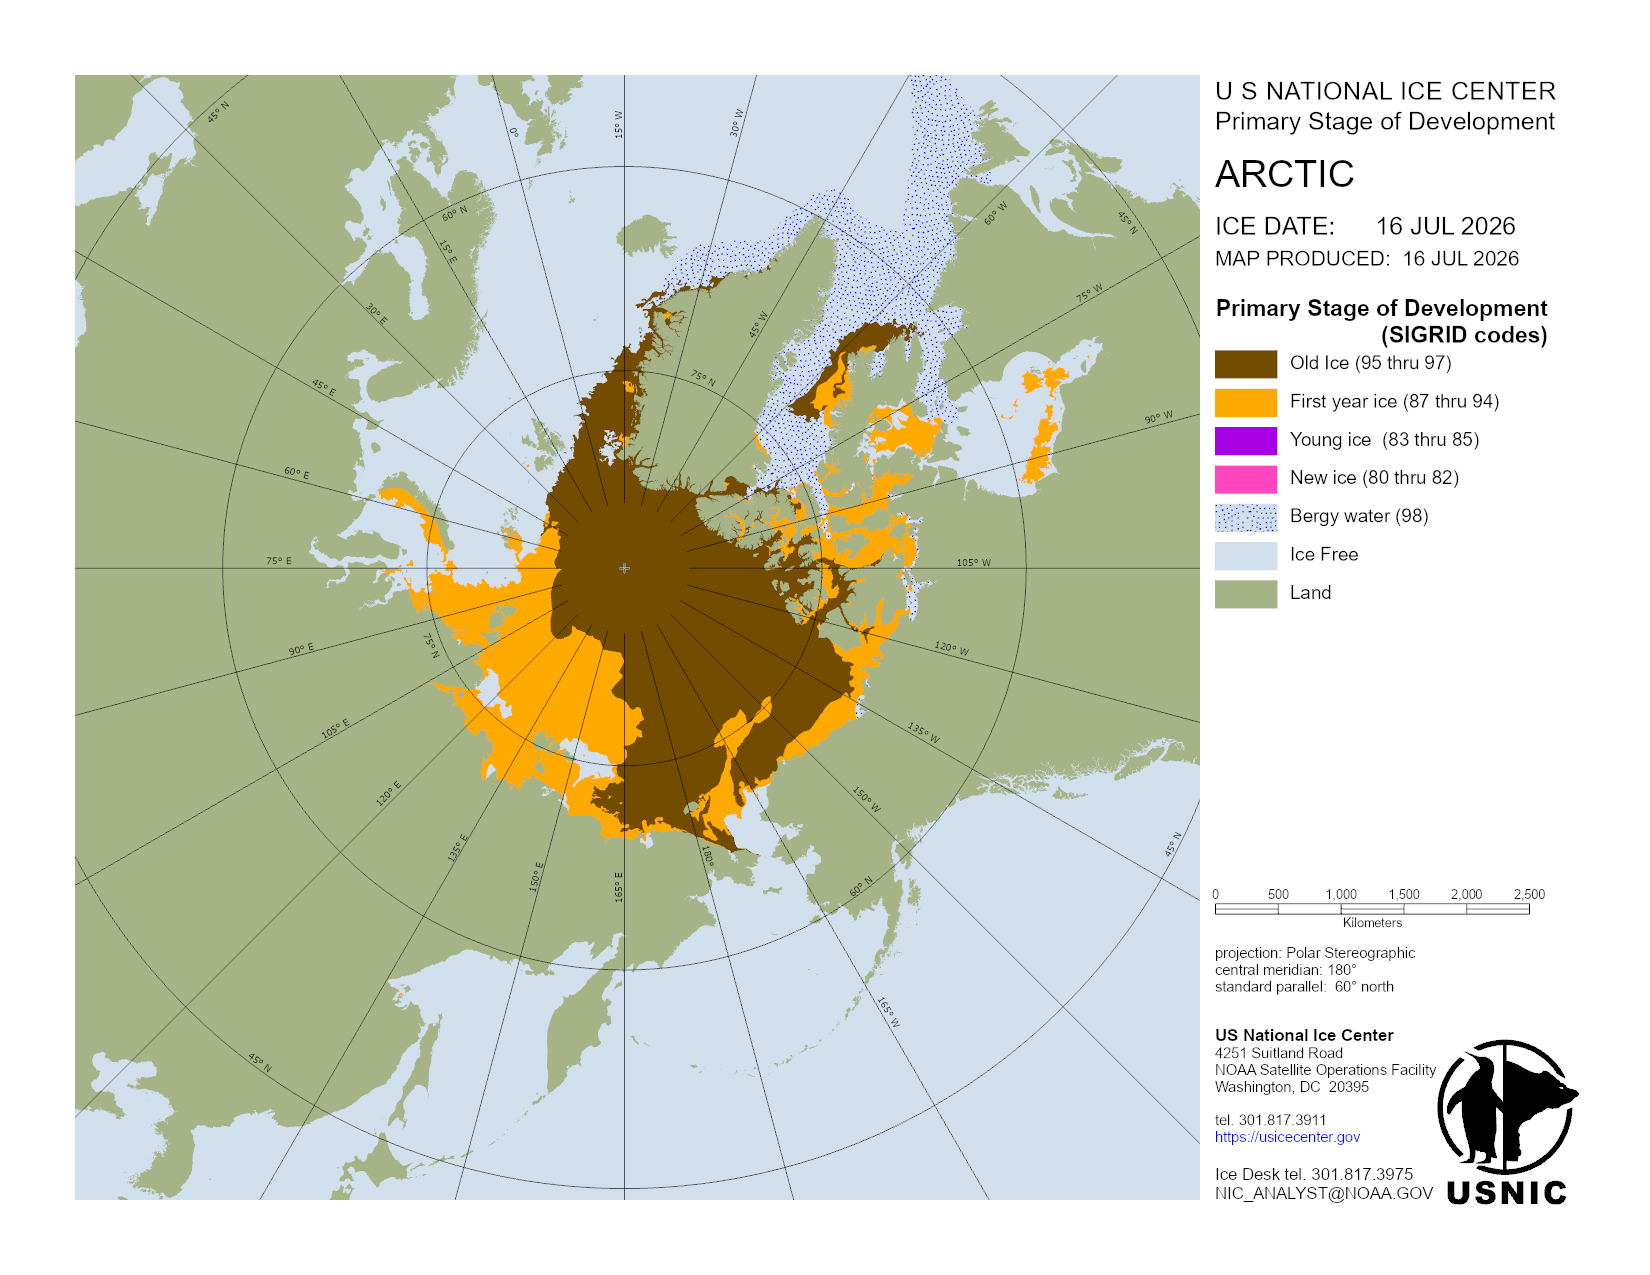
Weekly Stage of Development
A graphical representation of the estimated stage of development/ice thickness based on the weekly ice analysis.
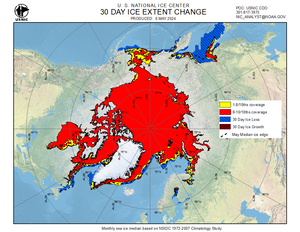
30-Day Ice Change
A graphical representation of the change in sea ice extent over the last 30 Days.
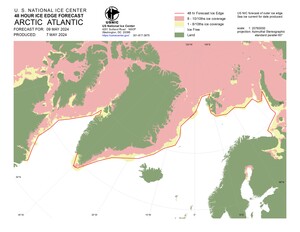
Arctic Daily Forecast Charts
A graphical representation of the daily ice analysis that depicts ice free in white, marginal ice zone (ice concentration up to 80%) in yellow, and pack ice (ice concentration 80% and greater) in pink. The graphic also displays the 48-hour forecast ice edge line. Both products are created to cover the entire Arctic based on region, Atlantic and Pacific.