Latest News
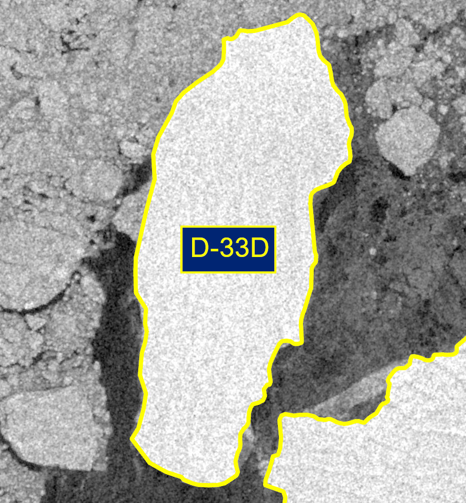
Iceberg D-33D Has Calved from Iceberg D-33A in the Weddell Sea
The U.S. National Ice Center (USNIC) has confirmed that iceberg D-33D calved from iceberg D-33A in the Weddell Sea. As of June 21, D-33A was centered at 64°12' South and 55°40' West and measured 19 nautical miles on its longest axis and 10 nautical miles on its widest axis. D-33D was centered at 64°25' South and 55°44' West and measured 15 nautical miles on its longest axis and 6 nautical miles on its widest axis. The break was first seen on satellite imagery on June 20. D-33A first calved from the Borchgrevink Ice Shelf in August 2023.
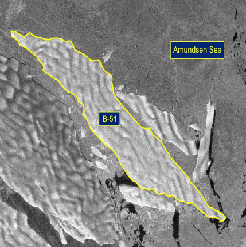
Iceberg B-51 Has Calved From Getz Ice Shelf
The U.S. National Ice Center (USNIC) has confirmed that iceberg B-51 calved from the Getz Ice Shelf. As of May 5, B-51 was centered at 74° 19' South and 130° 02' West and measured 16 nautical miles on its longest axis and 3 nautical miles on its widest axis.
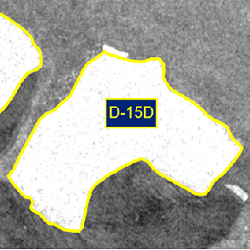
Iceberg D-15D Has Calved from Iceberg D-15C
The U.S. National Ice Center (USNIC) has confirmed that iceberg D-15D calved from D-15C in the southern Amery Sea along the West Ice Shelf. As of May 5th, D-15C was centered at 67° 08' South and 79° 29' East and measured 14 nautical miles on its longest axis and 7 nautical miles on its widest axis. D-15D was centered at 67° 15' South and 79° 20' East and measured 8 nautical miles on its longest axis and 6 nautical miles on its widest axis. D-15 originally calved form the West Ice Shelf and once held the title of world’s largest iceberg.

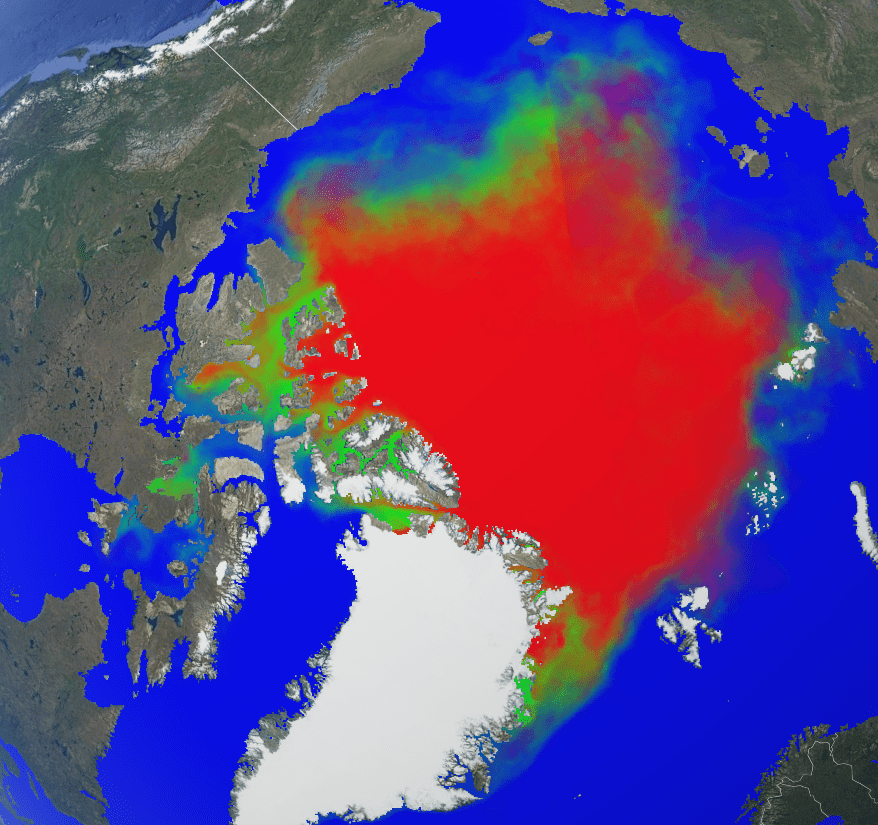
Arctic Sea Ice at Minimum and Maximum Extents (2025–2026)
The U.S. National Ice Center (USNIC) has determined the 2025 minimum and 2026 maximum Arctic sea ice extents based on analysis from the USNIC’s Interactive Multisensor Snow and Ice Mapping System (IMS), used in the Multisensor Analyzed Sea Ice Extent (MASIE) product, jointly created with the National Snow and Ice Data Center (NSIDC).
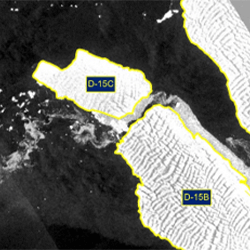
Iceberg D-15C Has Calved from Iceberg D-15B
The U.S. National Ice Center (USNIC) has confirmed that iceberg D-15C calved from D-15B in the southern Amery Sea along the West Ice Shelf. As of February 13th, D-15B was centered at 67° 02' South and 81° 34' East and measured 21 nautical miles on its longest axis and 12 nautical miles on its widest axis. D-15C was centered at 66° 50' South and 81° 03' East and measured 14 nautical miles on its longest axis and 7 nautical miles on its widest axis. D-15 originally calved form the West Ice Shelf and once held the title of world’s largest iceberg.
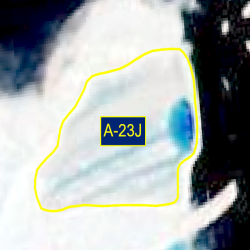
Iceberg A-23J Has Calved from Iceberg A-23A
The U.S. National Ice Center (USNIC) has confirmed that iceberg A-23J calved from A-23A in the northern Weddell Sea. As of January 16th, A-23A was centered at 52° 44' South and 41° 21' West and measured 16 nautical miles on its longest axis and 15 nautical miles on its widest axis. A-23J was centered at 52° 51' South and 41° 43' West and measured 11 nautical miles on its longest axis and 8 nautical miles on its widest axis. A-23A first calved from the Ronne Ice Shelf in 1986.
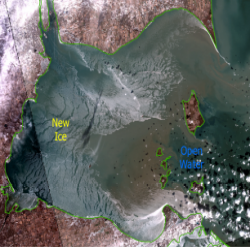
Great Lakes Experiences Rapid Early Winter Ice Growth Followed by a Late-December Thaw
The U.S. National Ice Center (USNIC) has been tracking the fast start to the Great Lakes ice season. USNIC and the Canadian Ice Service began the annual production of joint Great Lakes daily ice charts on 29 November 2025, following observations of ice formation in Black Bay (Lake Superior). Colder than normal temperatures were experienced through the first two weeks of December which led to unseasonably high ice coverage across the Great Lakes.
Featured Products
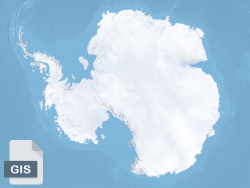
Antarctic Ice Shelf
Antarctic ice shelf has been updated to the 2022 version and is available in GIS shapefile format.
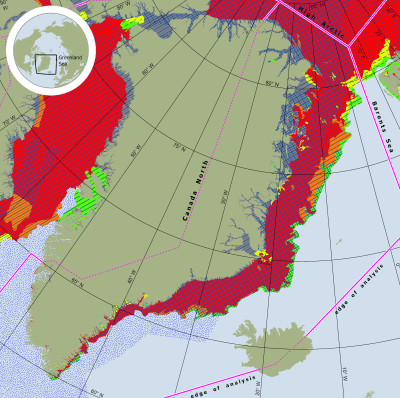
Regional Synopsis
The U.S. National Ice Center has developed a new series charts. Regional Synopsis charts breaks out each region of the Arctic and Antarctic into a high quality regional charts along with an environment synopsis write-up. Charts will be updated weekly. Please take a look.
Animated Charts
Added animated charts of our Arctic and Antarctic MIZ, and IMS snow and ice charts.
Trivariate Products
A comprehensive look at ice conditions over a period time, from a single year to a comparison set starting from 2007. Produced for the Arctic and Antarctic.