Great Lakes Products
Great Lakes products are created in cooperation with U.S. National Ice Center and Canadian Ice Service under the North American Ice Service (NAIS). Ice charts and support files are based off the daily ice analysis of the Great Lakes. NAIS also produces 30 day outlooks twice a month along with an annual outlook and end of season summary.
Area
Description
Display / Format
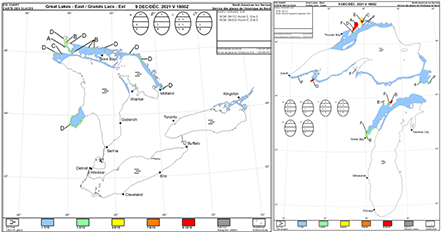
Great Lakes Concentration Ice Charts
Daily ice chart that represents current ice concentration for eastern/western Great Lakes waters during their ice season. Ice concentration is shown in color. Additionally, WMO egg code represents ice concentration, ice stage of development with its concentration, and ice floe size. Ice charts are presented in color GIFs.
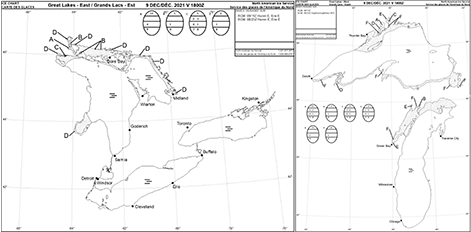
Great Lakes B/W Ice Charts
Daily ice chart that represents current ice coverage for eastern/western Great Lakes waters during their ice season. WMO egg code represents ice concentration, ice stage of development with its concentration, and ice floe size. Ice charts are presented in black and white GIFs.
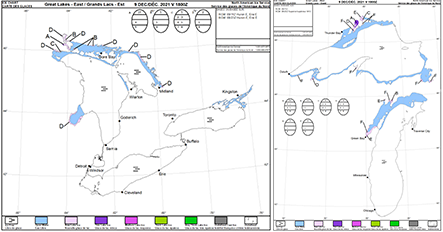
Great Lakes Stage of Development Ice Charts
Daily ice chart that represents current ice stage of development for eastern/western Great Lakes waters during their ice season. Ice stage of development is shown in color. Additionally, WMO egg code represents ice concentration, ice stage of development with its concentration, and ice floe size. Ice charts are presented in color GIFs.
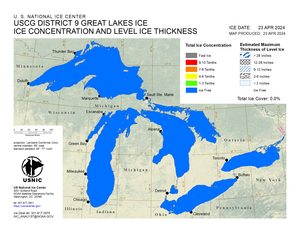
United States Coast Guard District 9 Ice Charts
Twice weekly (Tuesday and Thursday) ice charts that represents the current ice conditons for Great Lakes waters during their ice season. Ice coverage is detailed in 3 separate charts:
- Ice Concentration - color coded ice conditions based on concentration values in tenths.
- Ice Thickness - color coded ice conditions based on thickness values in inches.
- Ice Combination Chart - combined color and texture ice conditions based on both concentration and thickness.
- Four Panel Chart - all charts along with previous year Combination chart arranged in four panels.
View Chart
ConcentrationThickness
Combo Four Panel
Download PNG
Concentration Thickness Combo Four Panel Archive