Arctic Trivariate Products
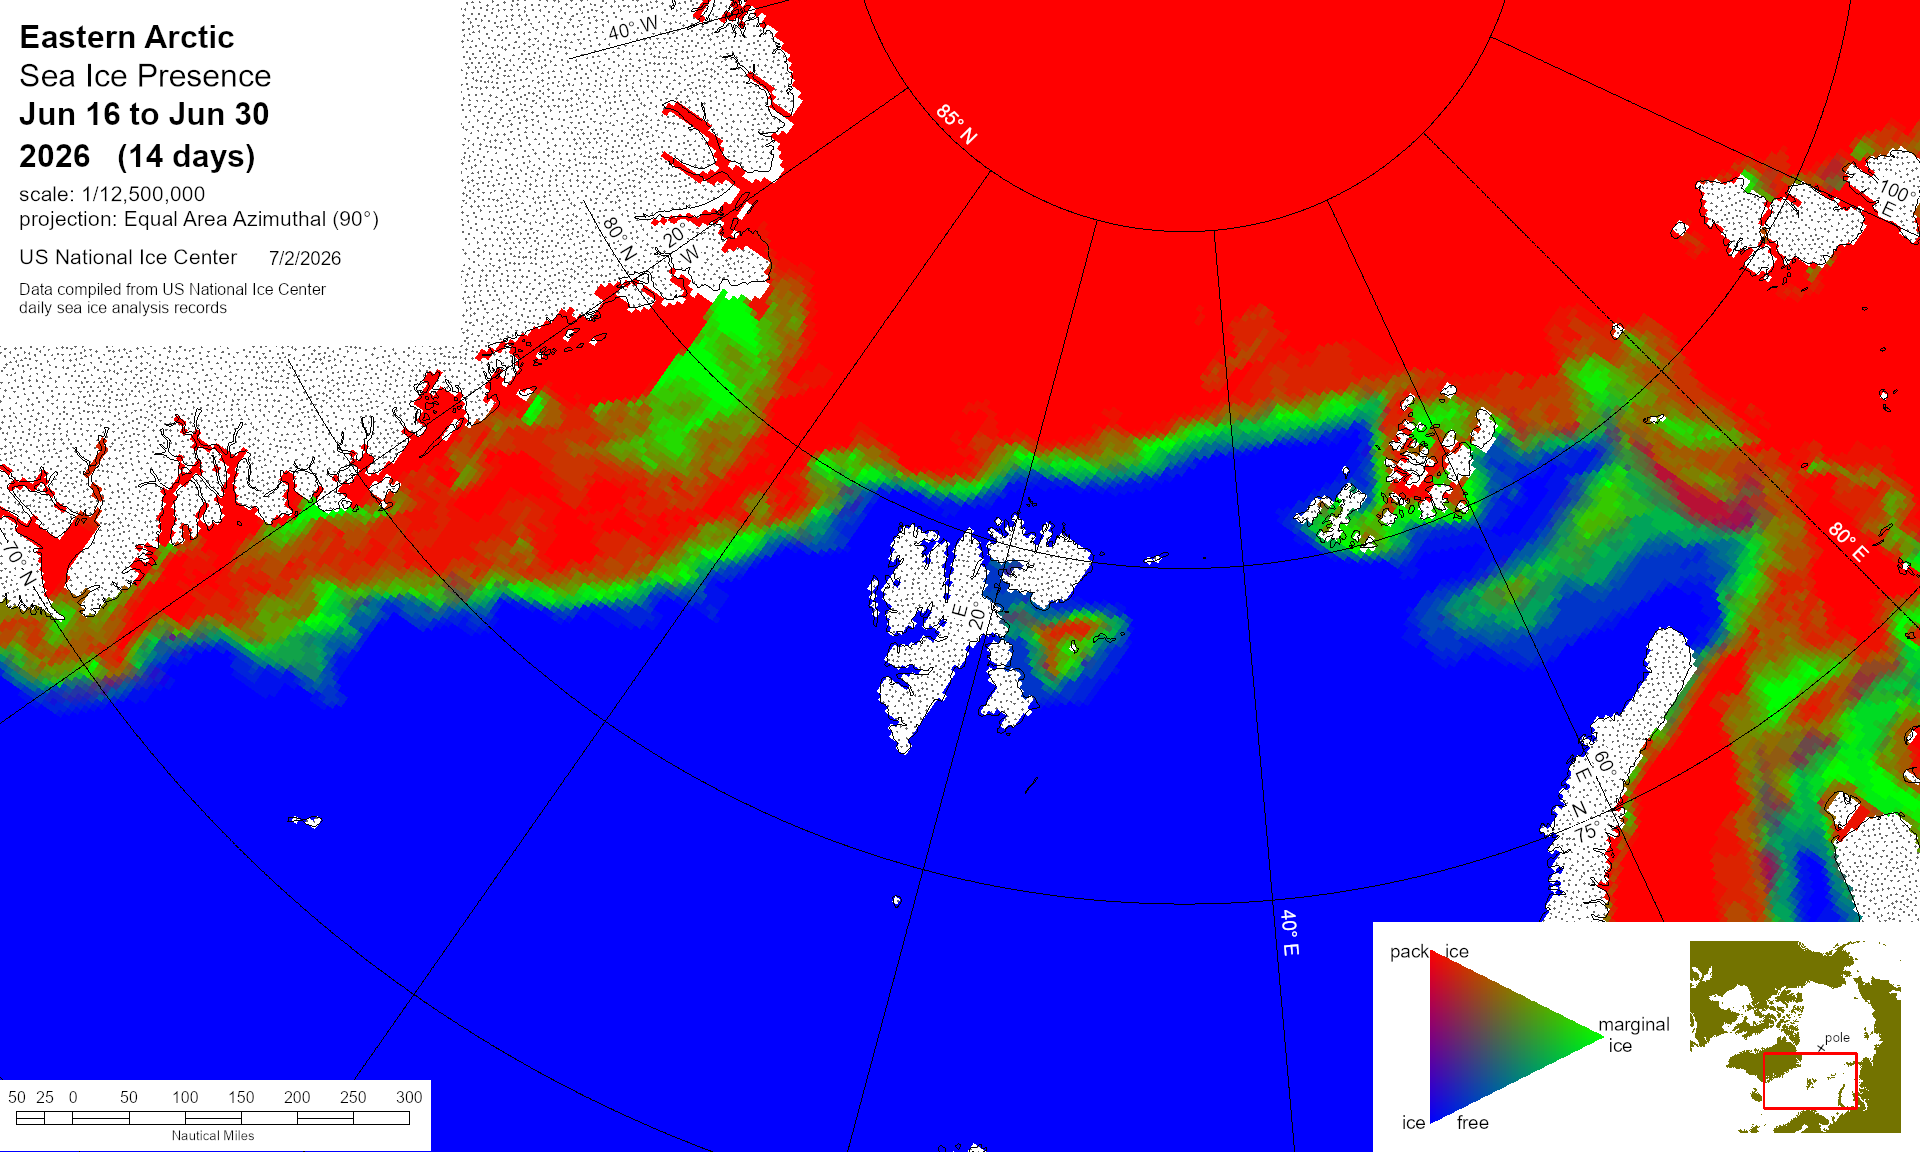
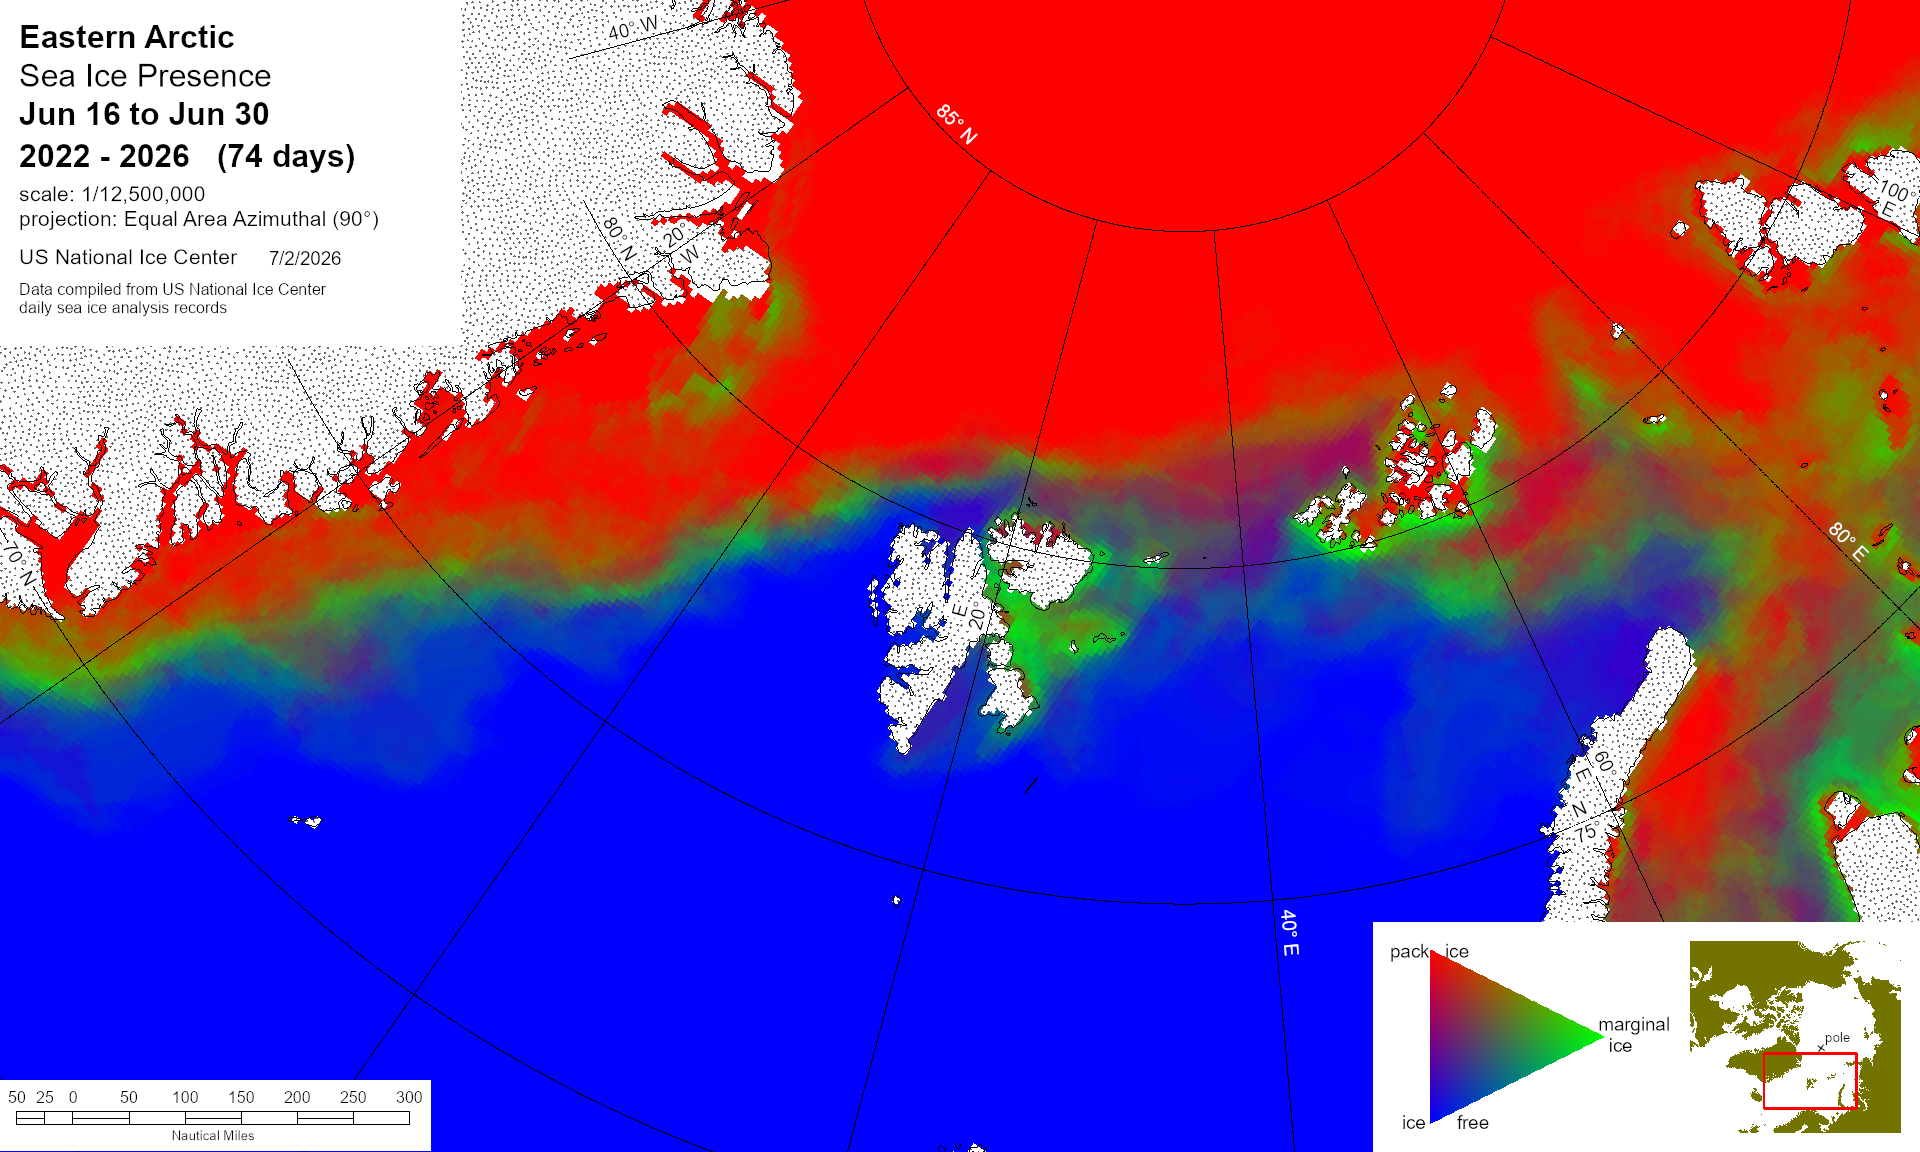
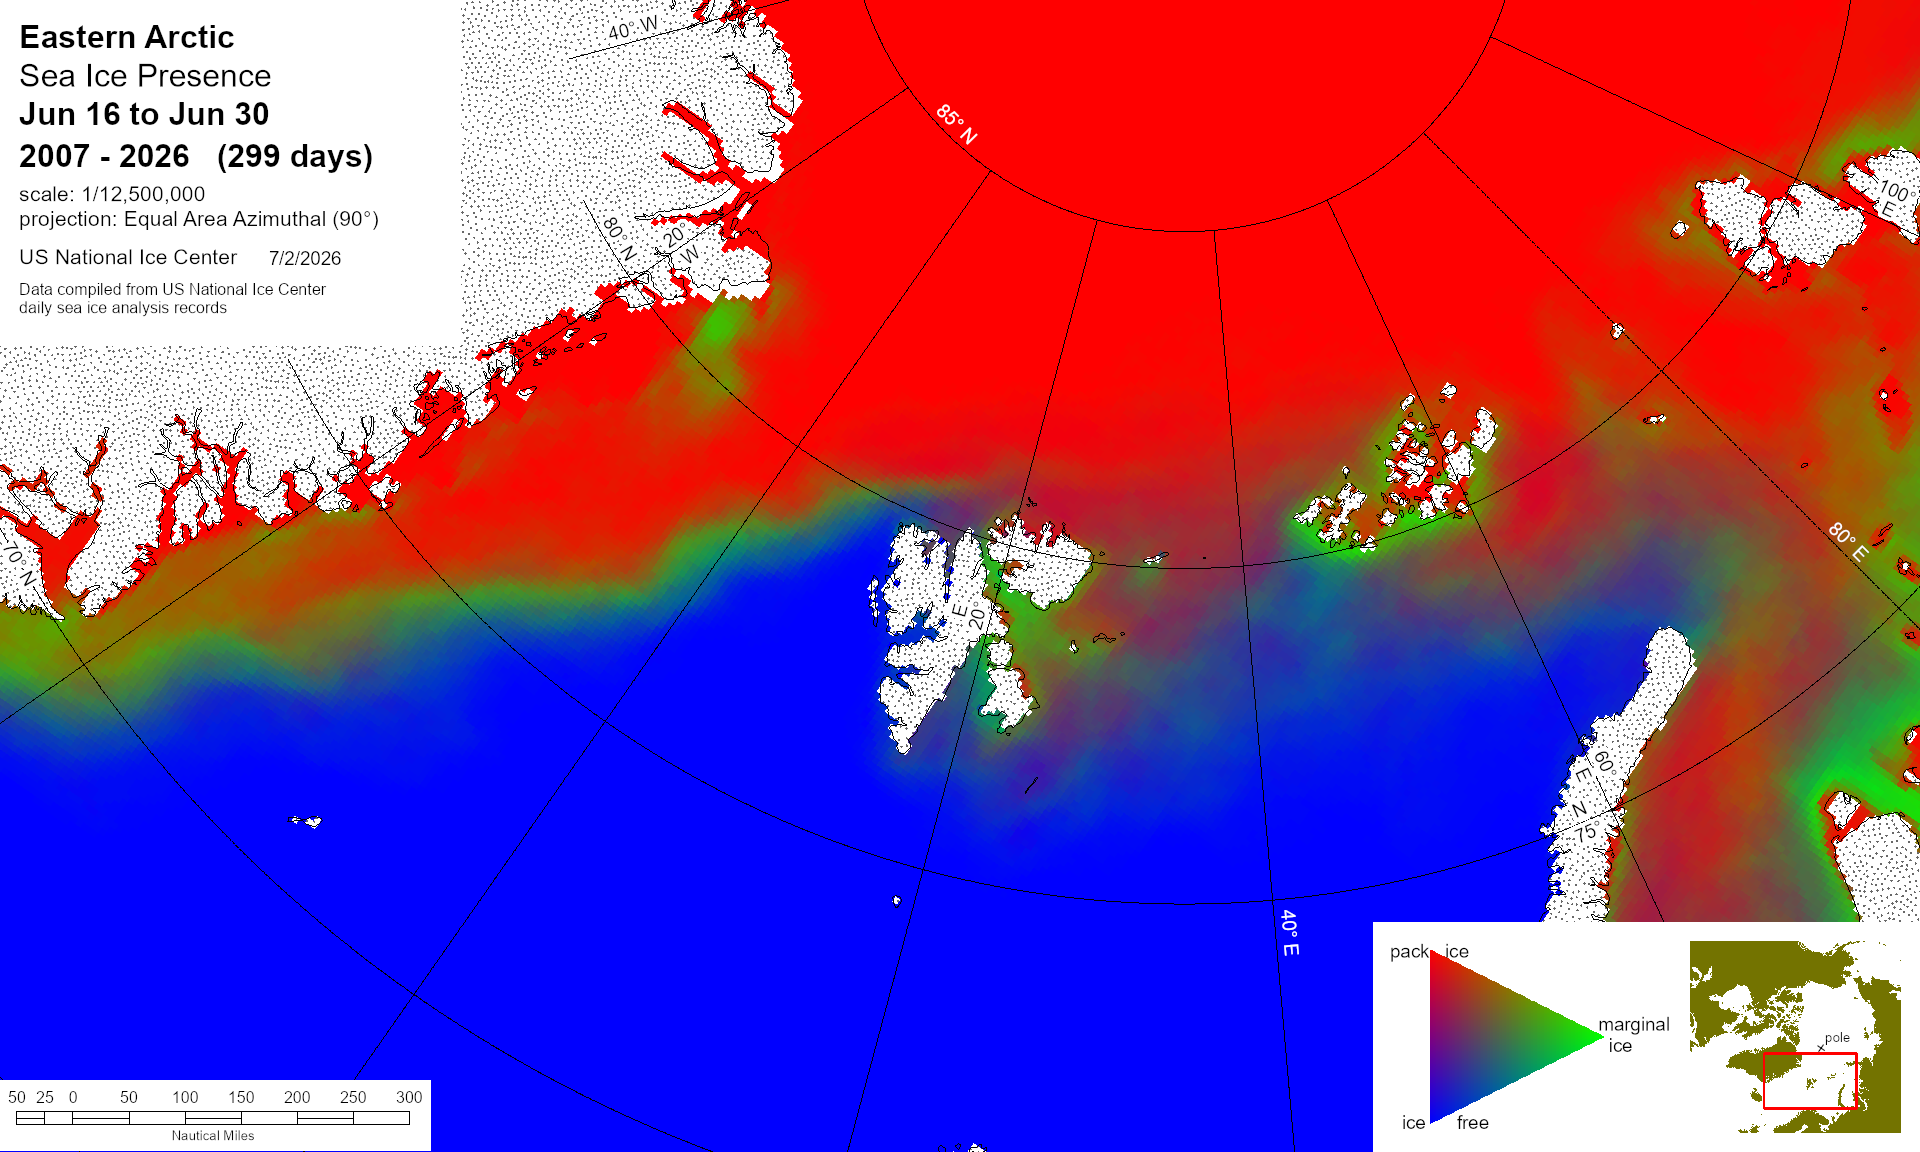
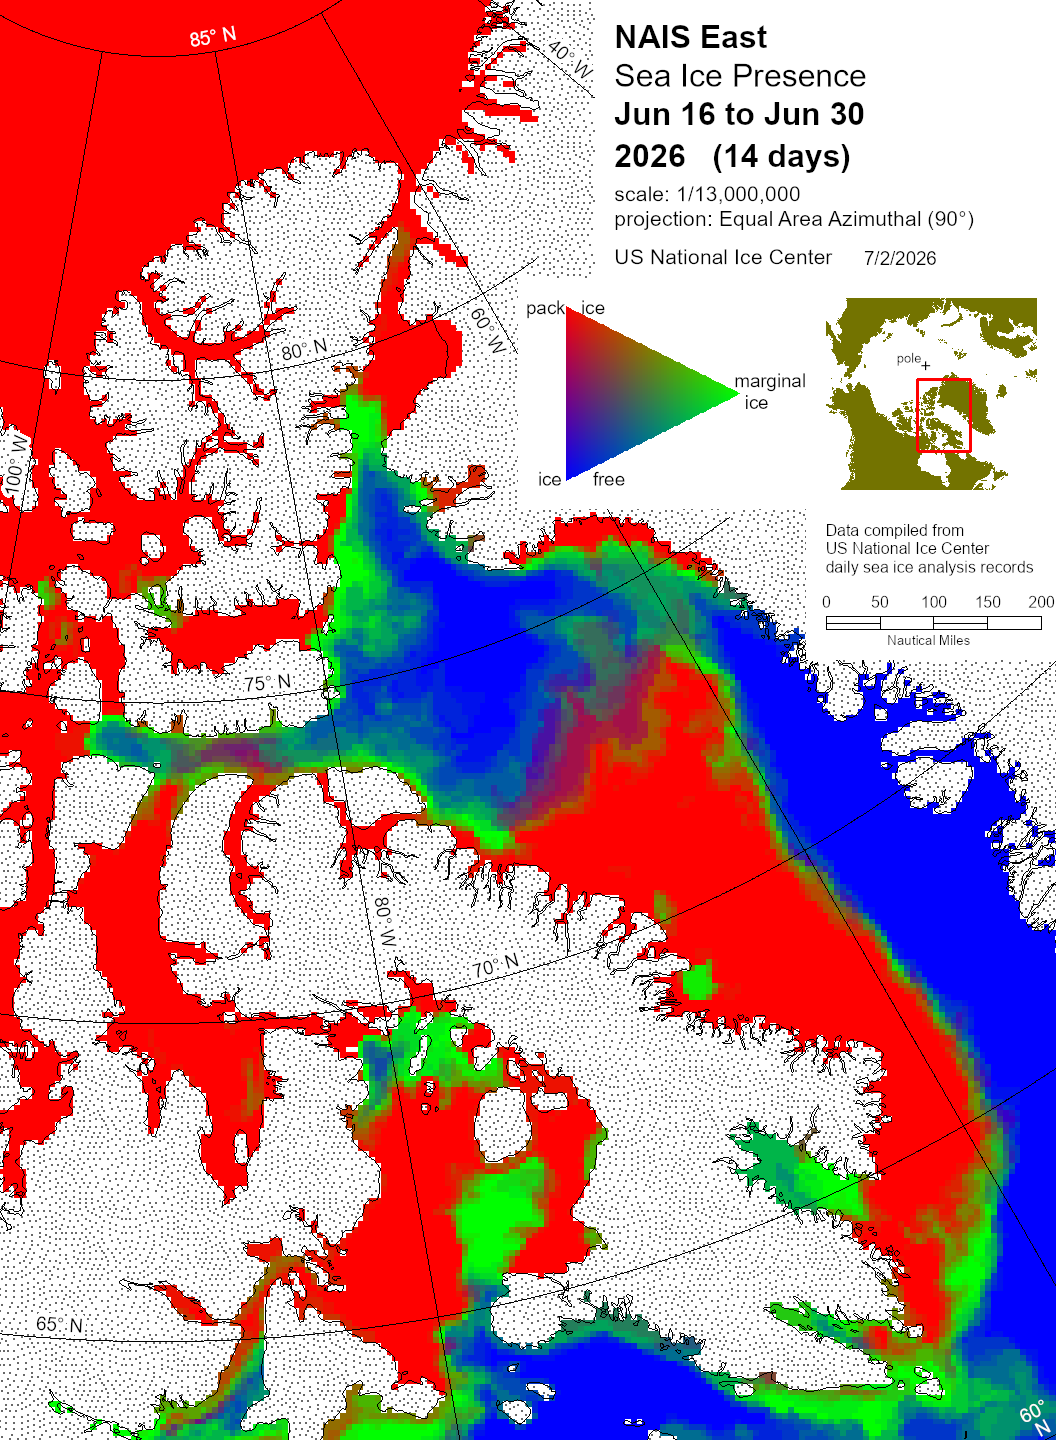
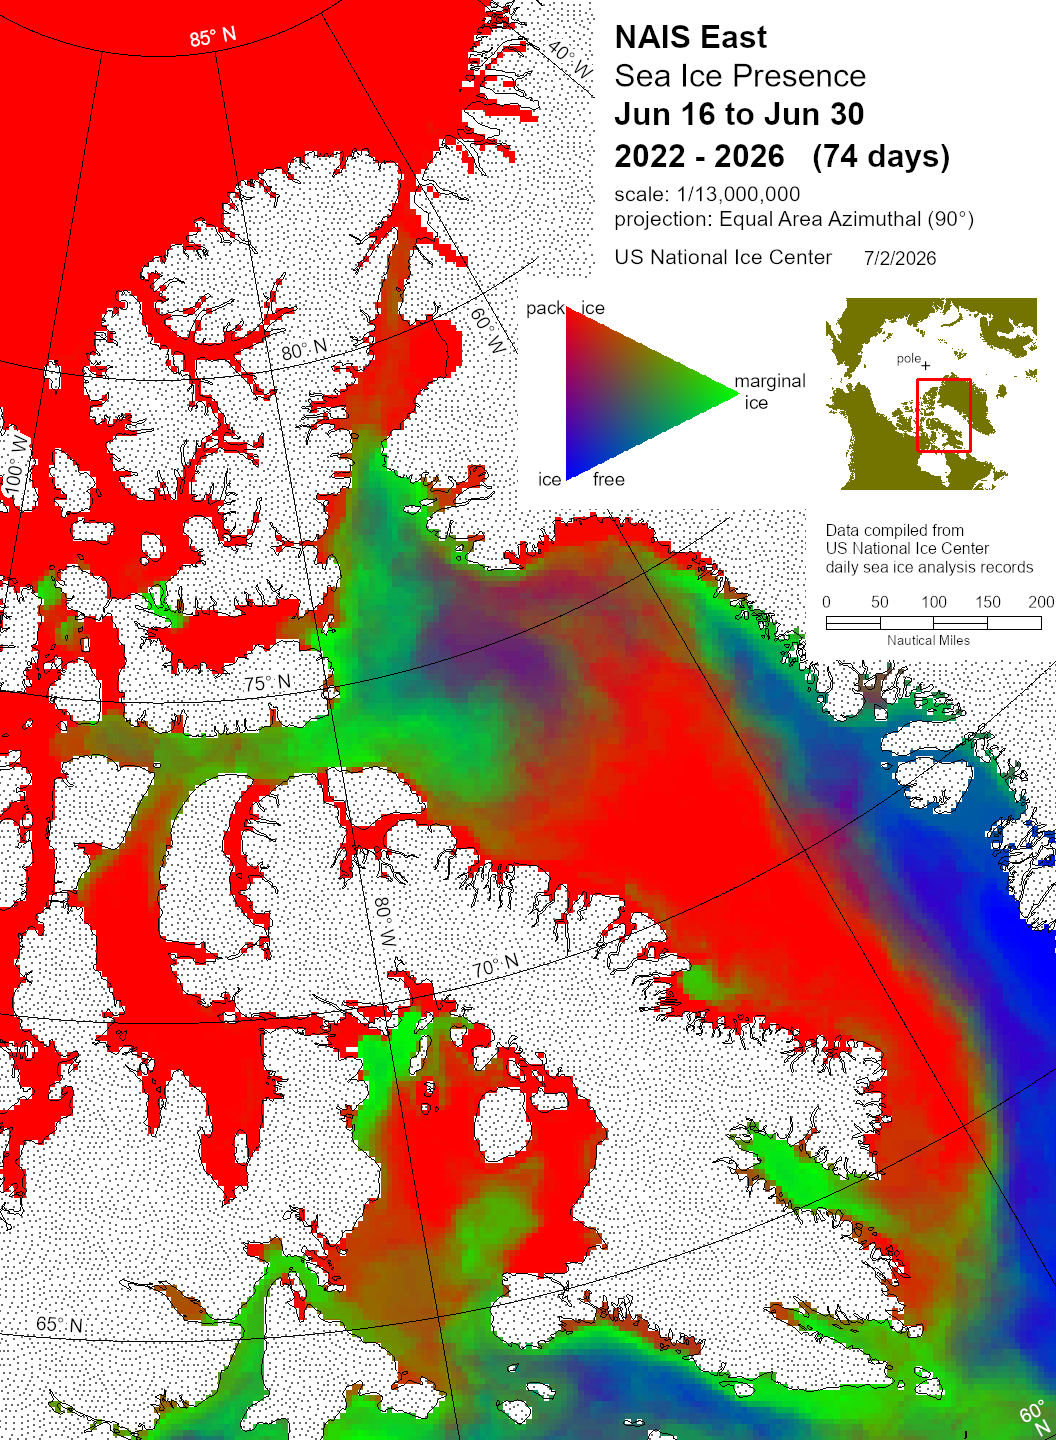
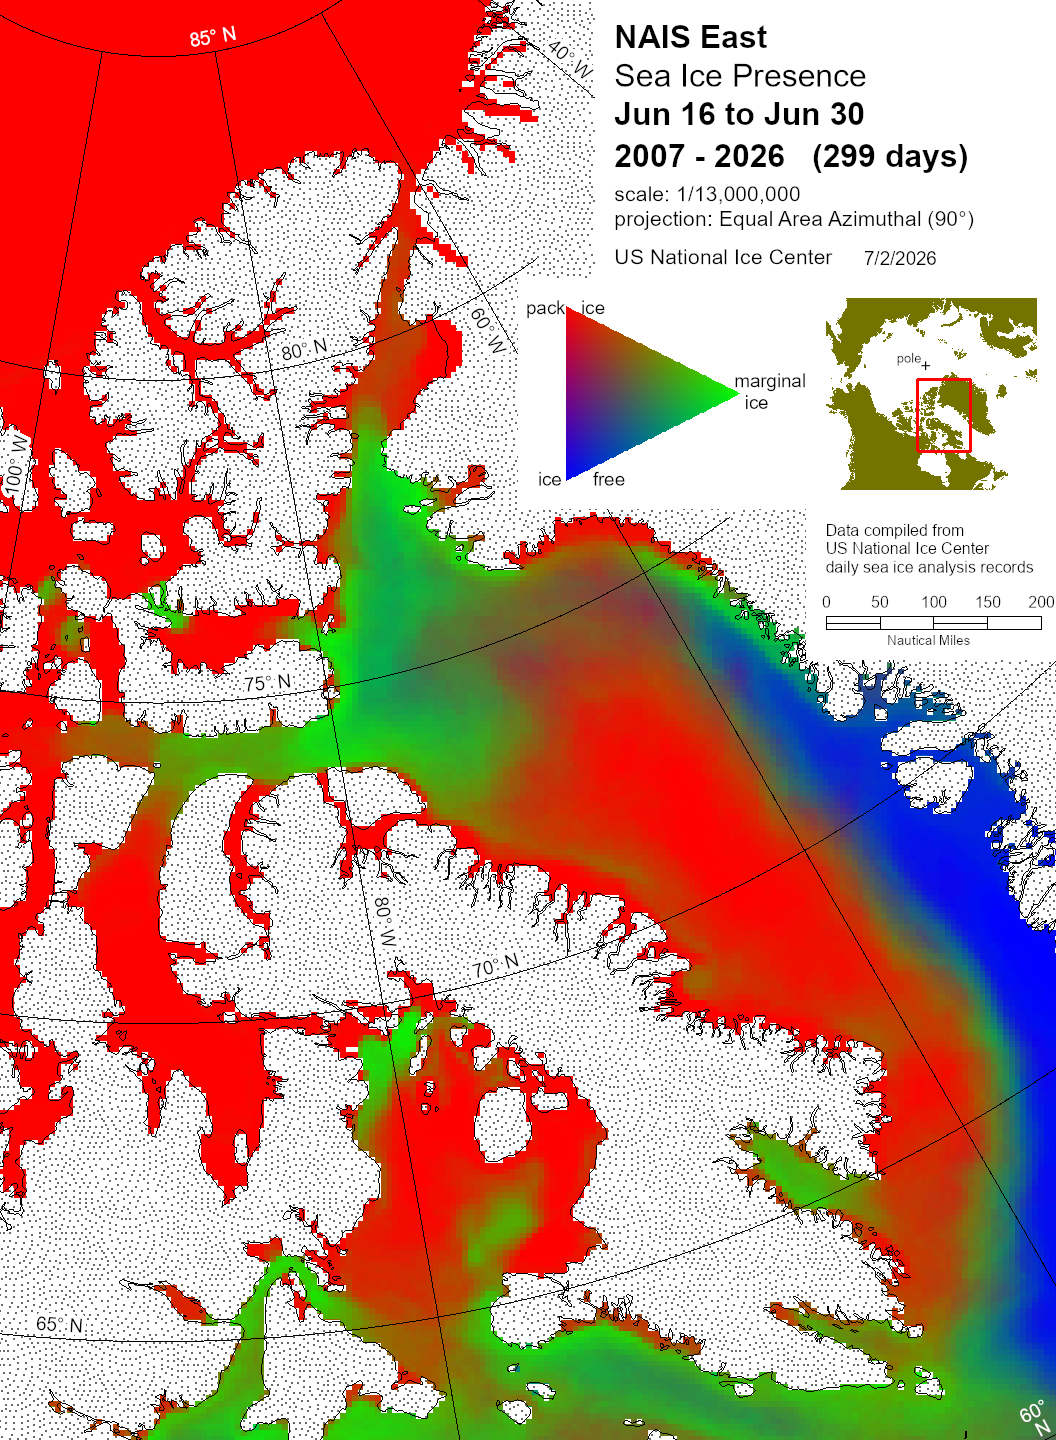
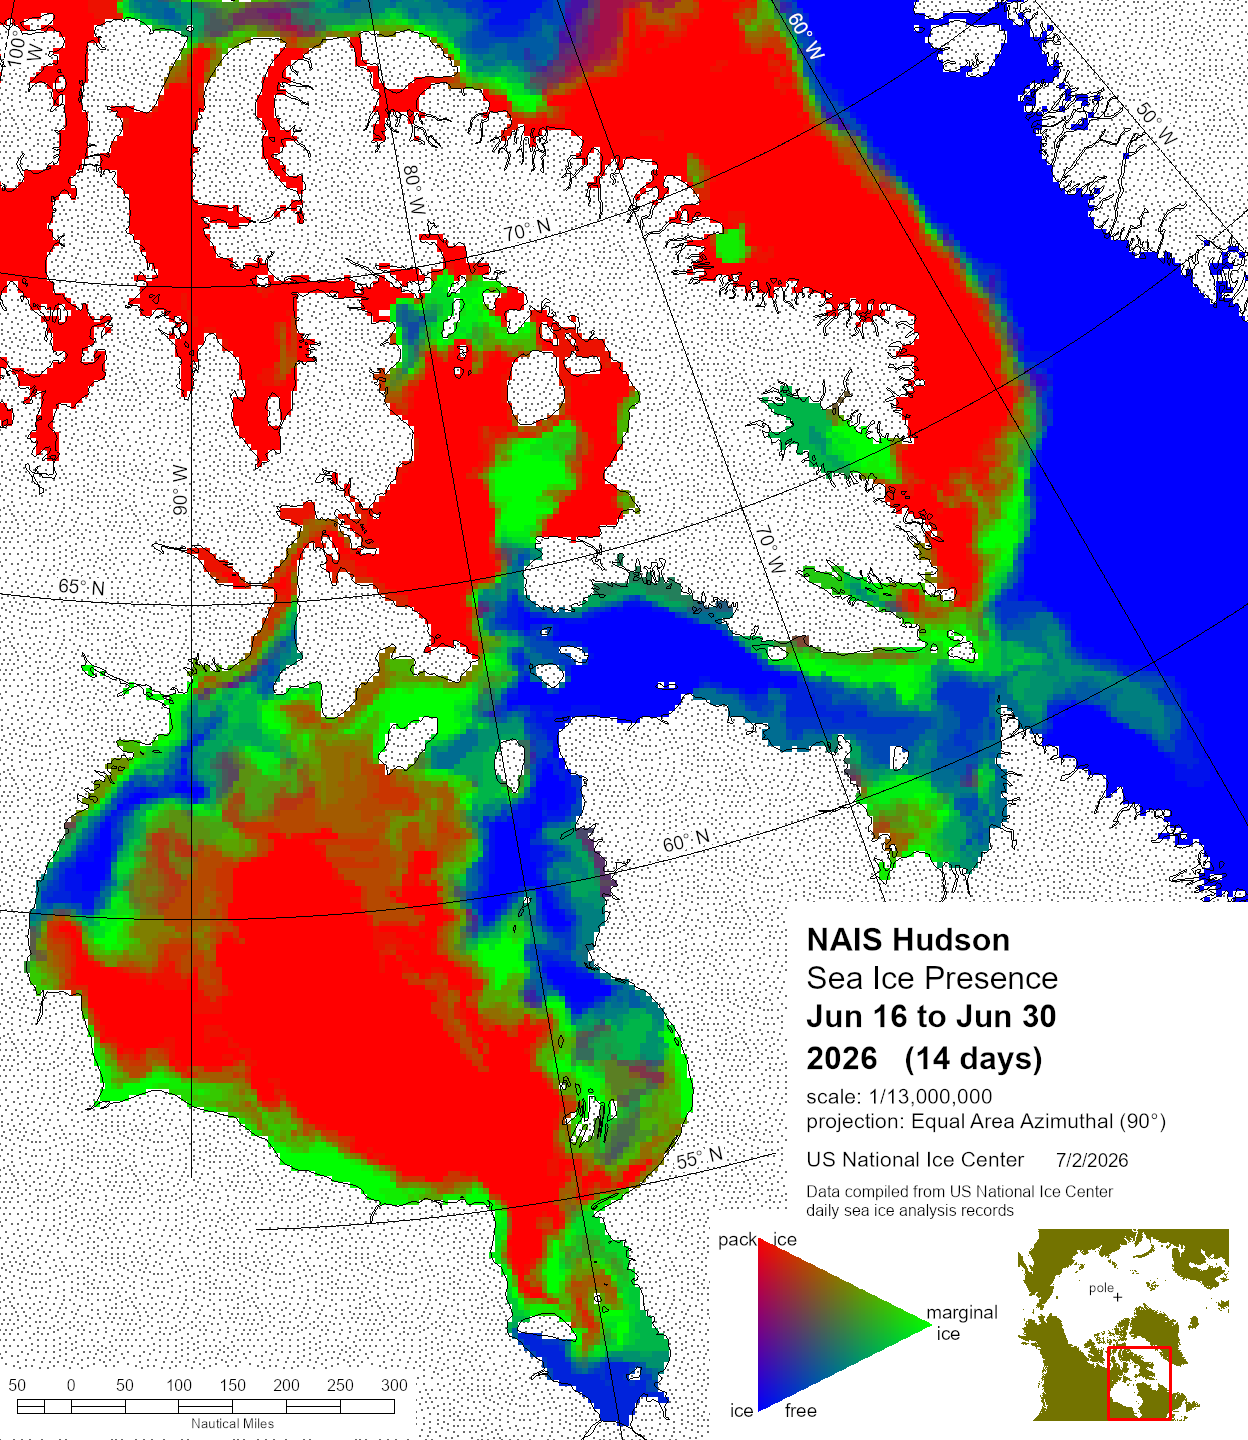
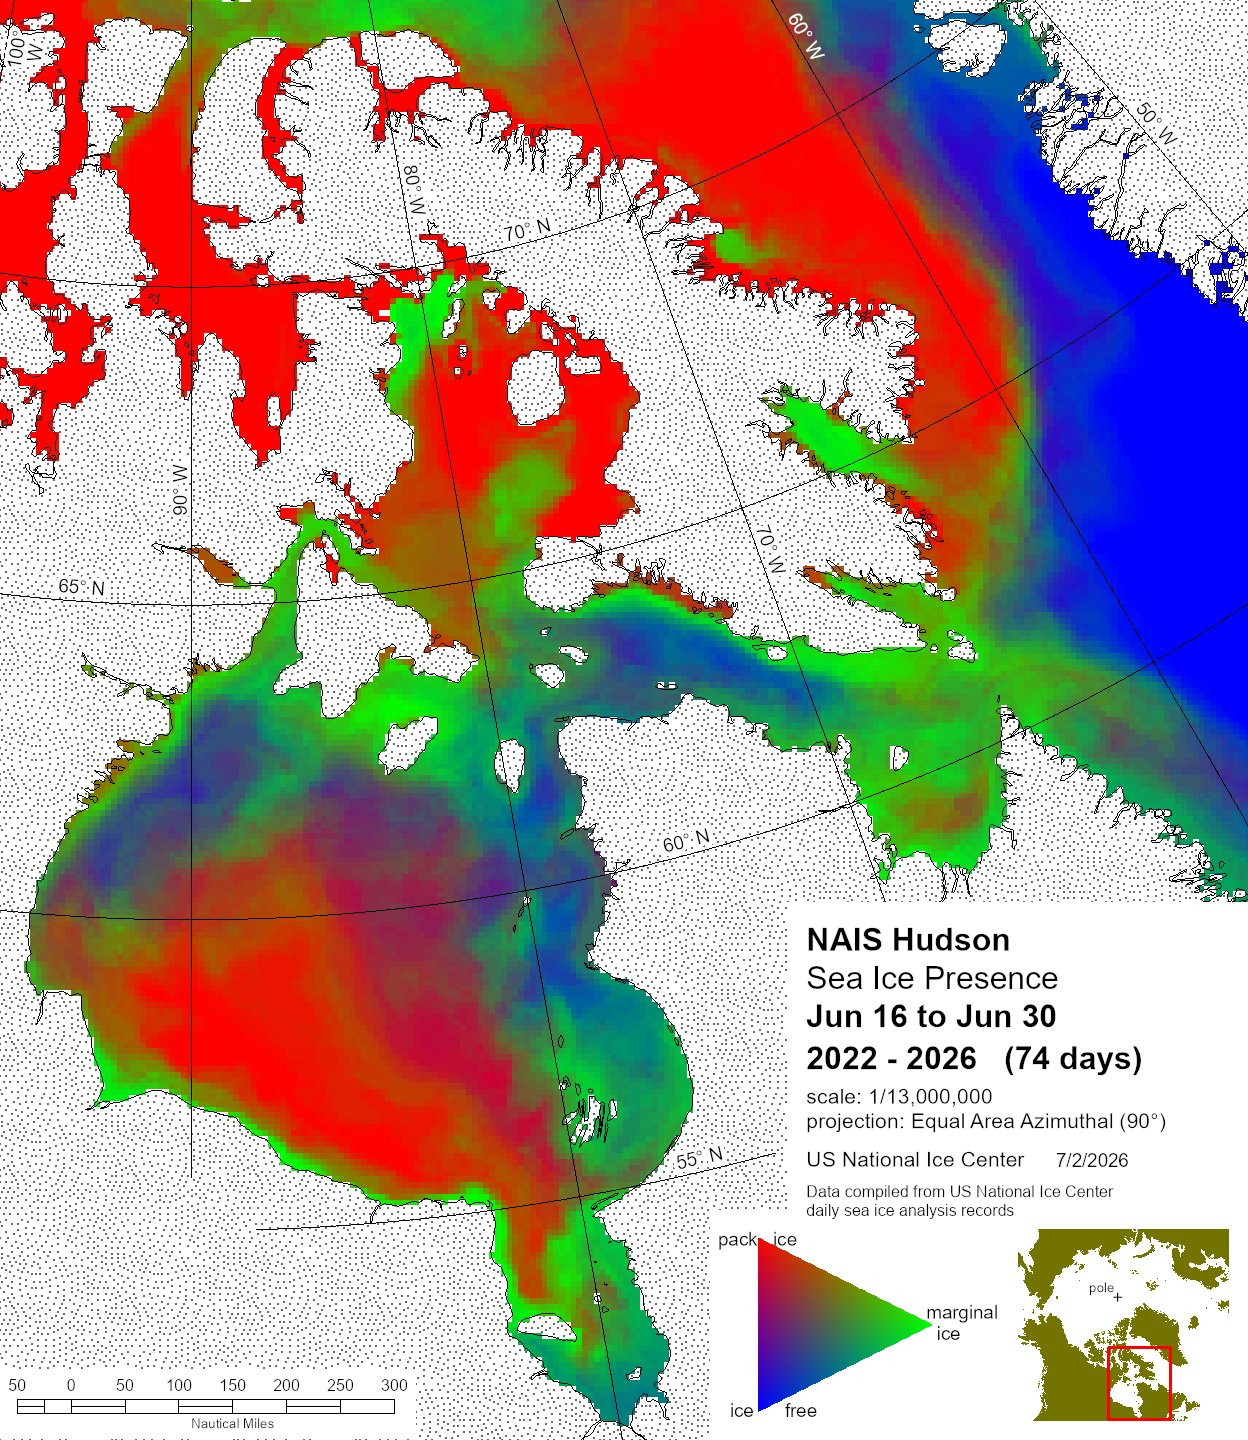
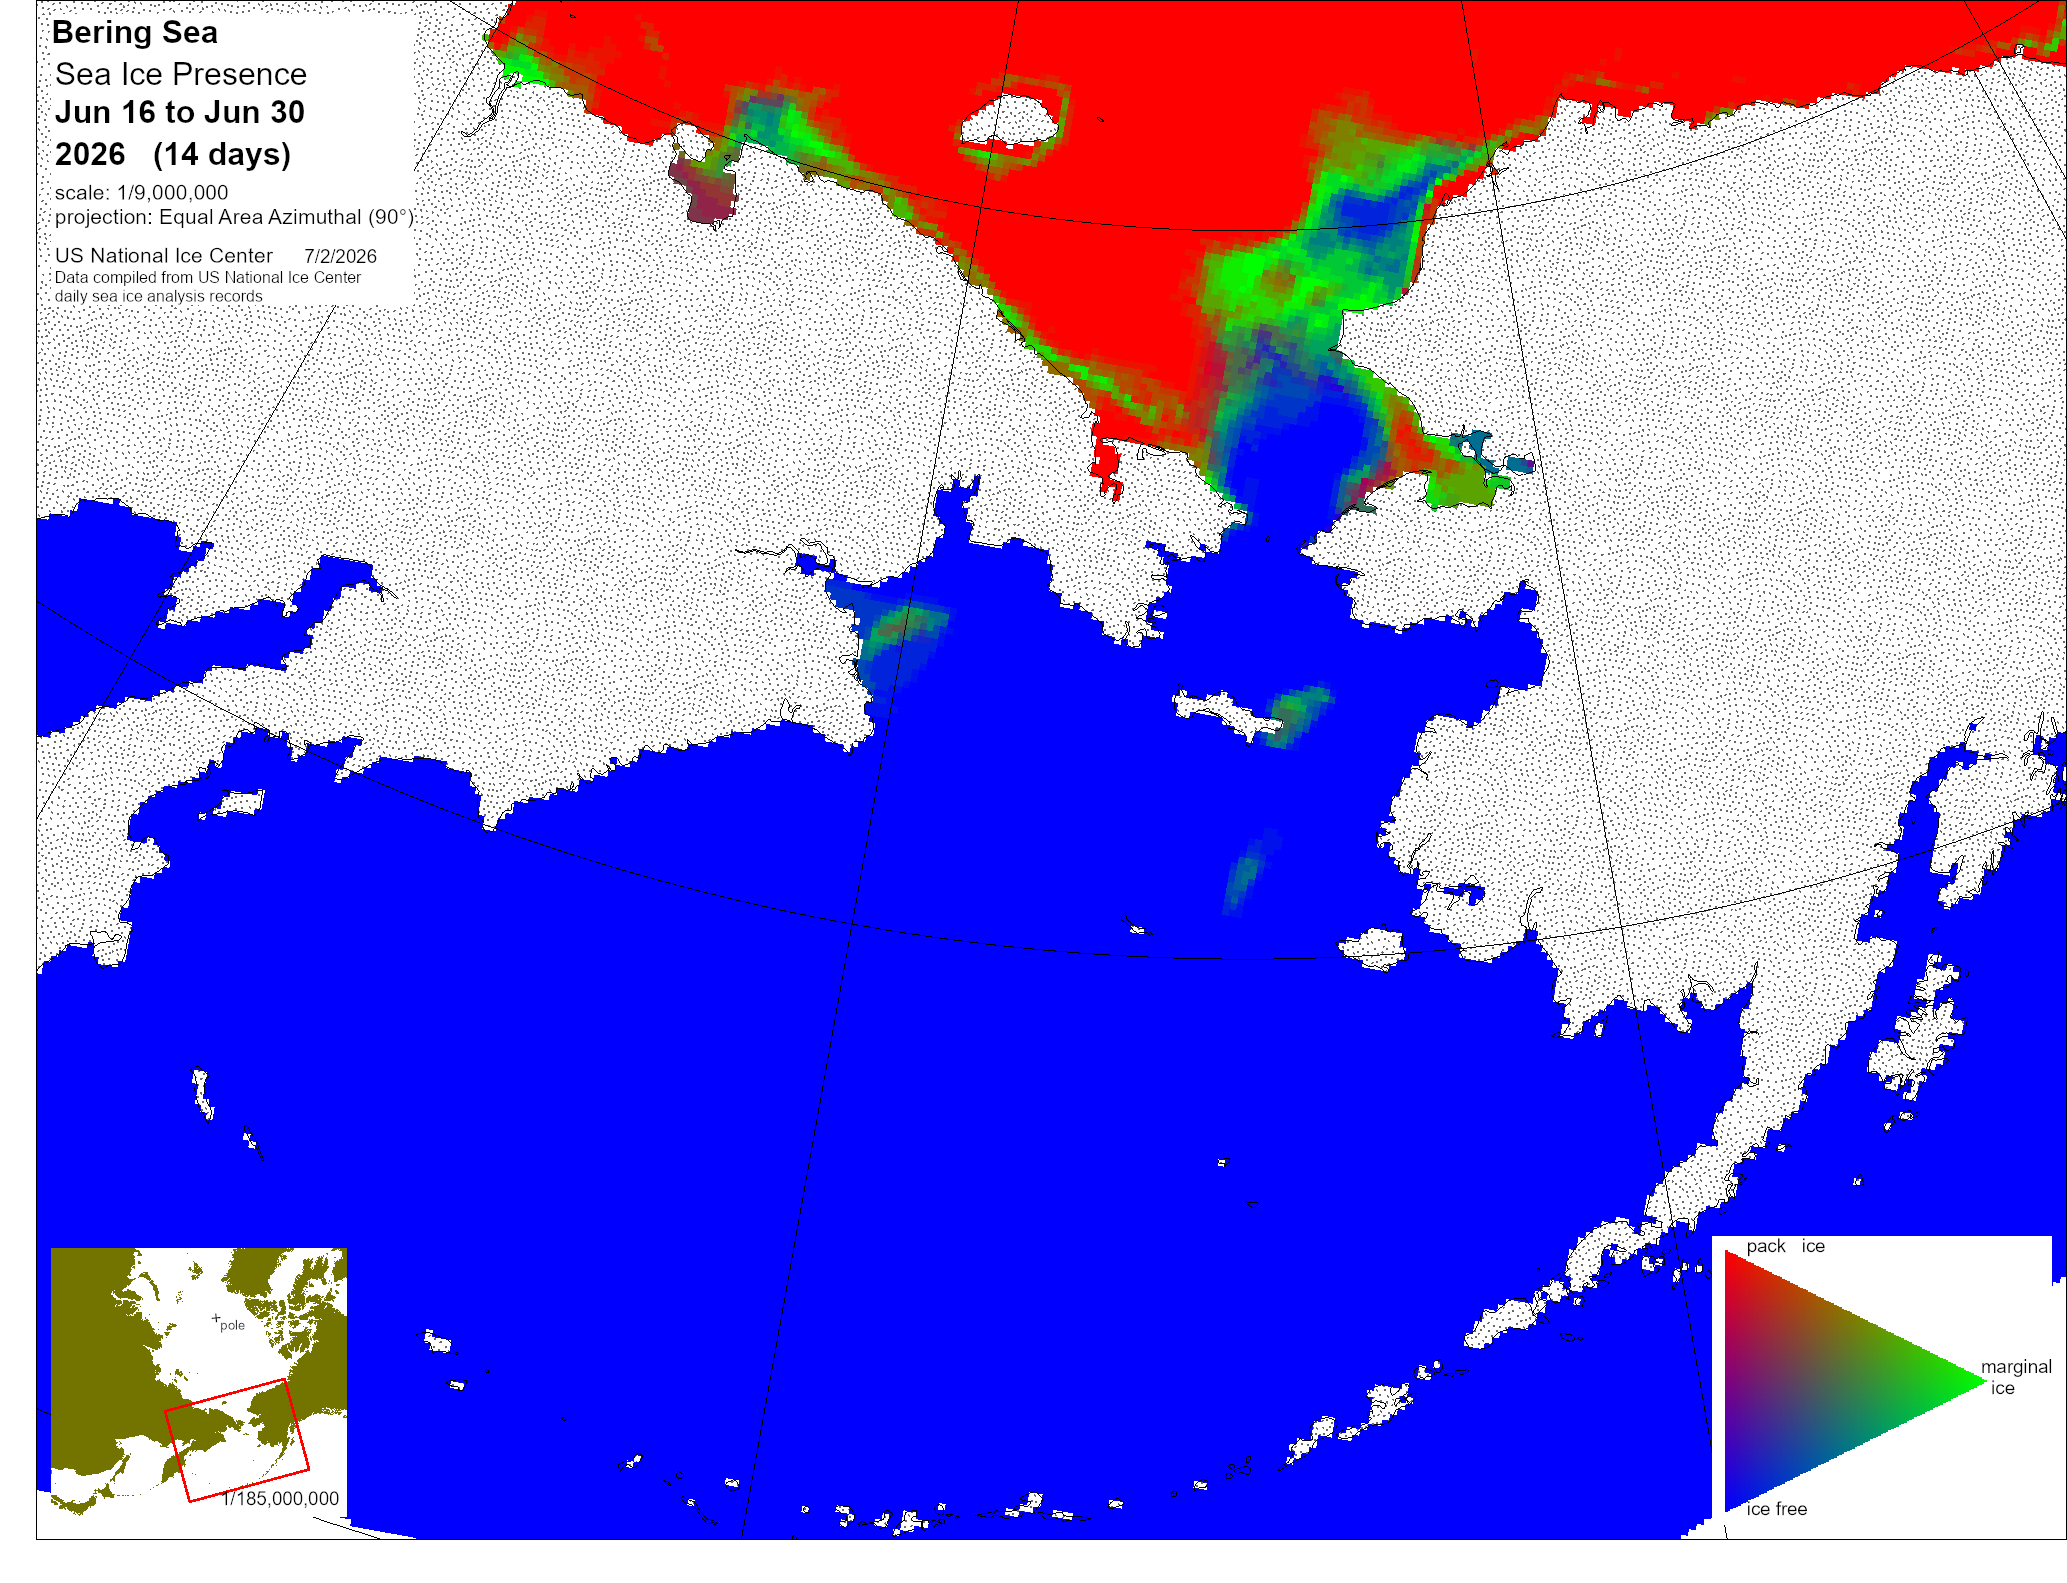
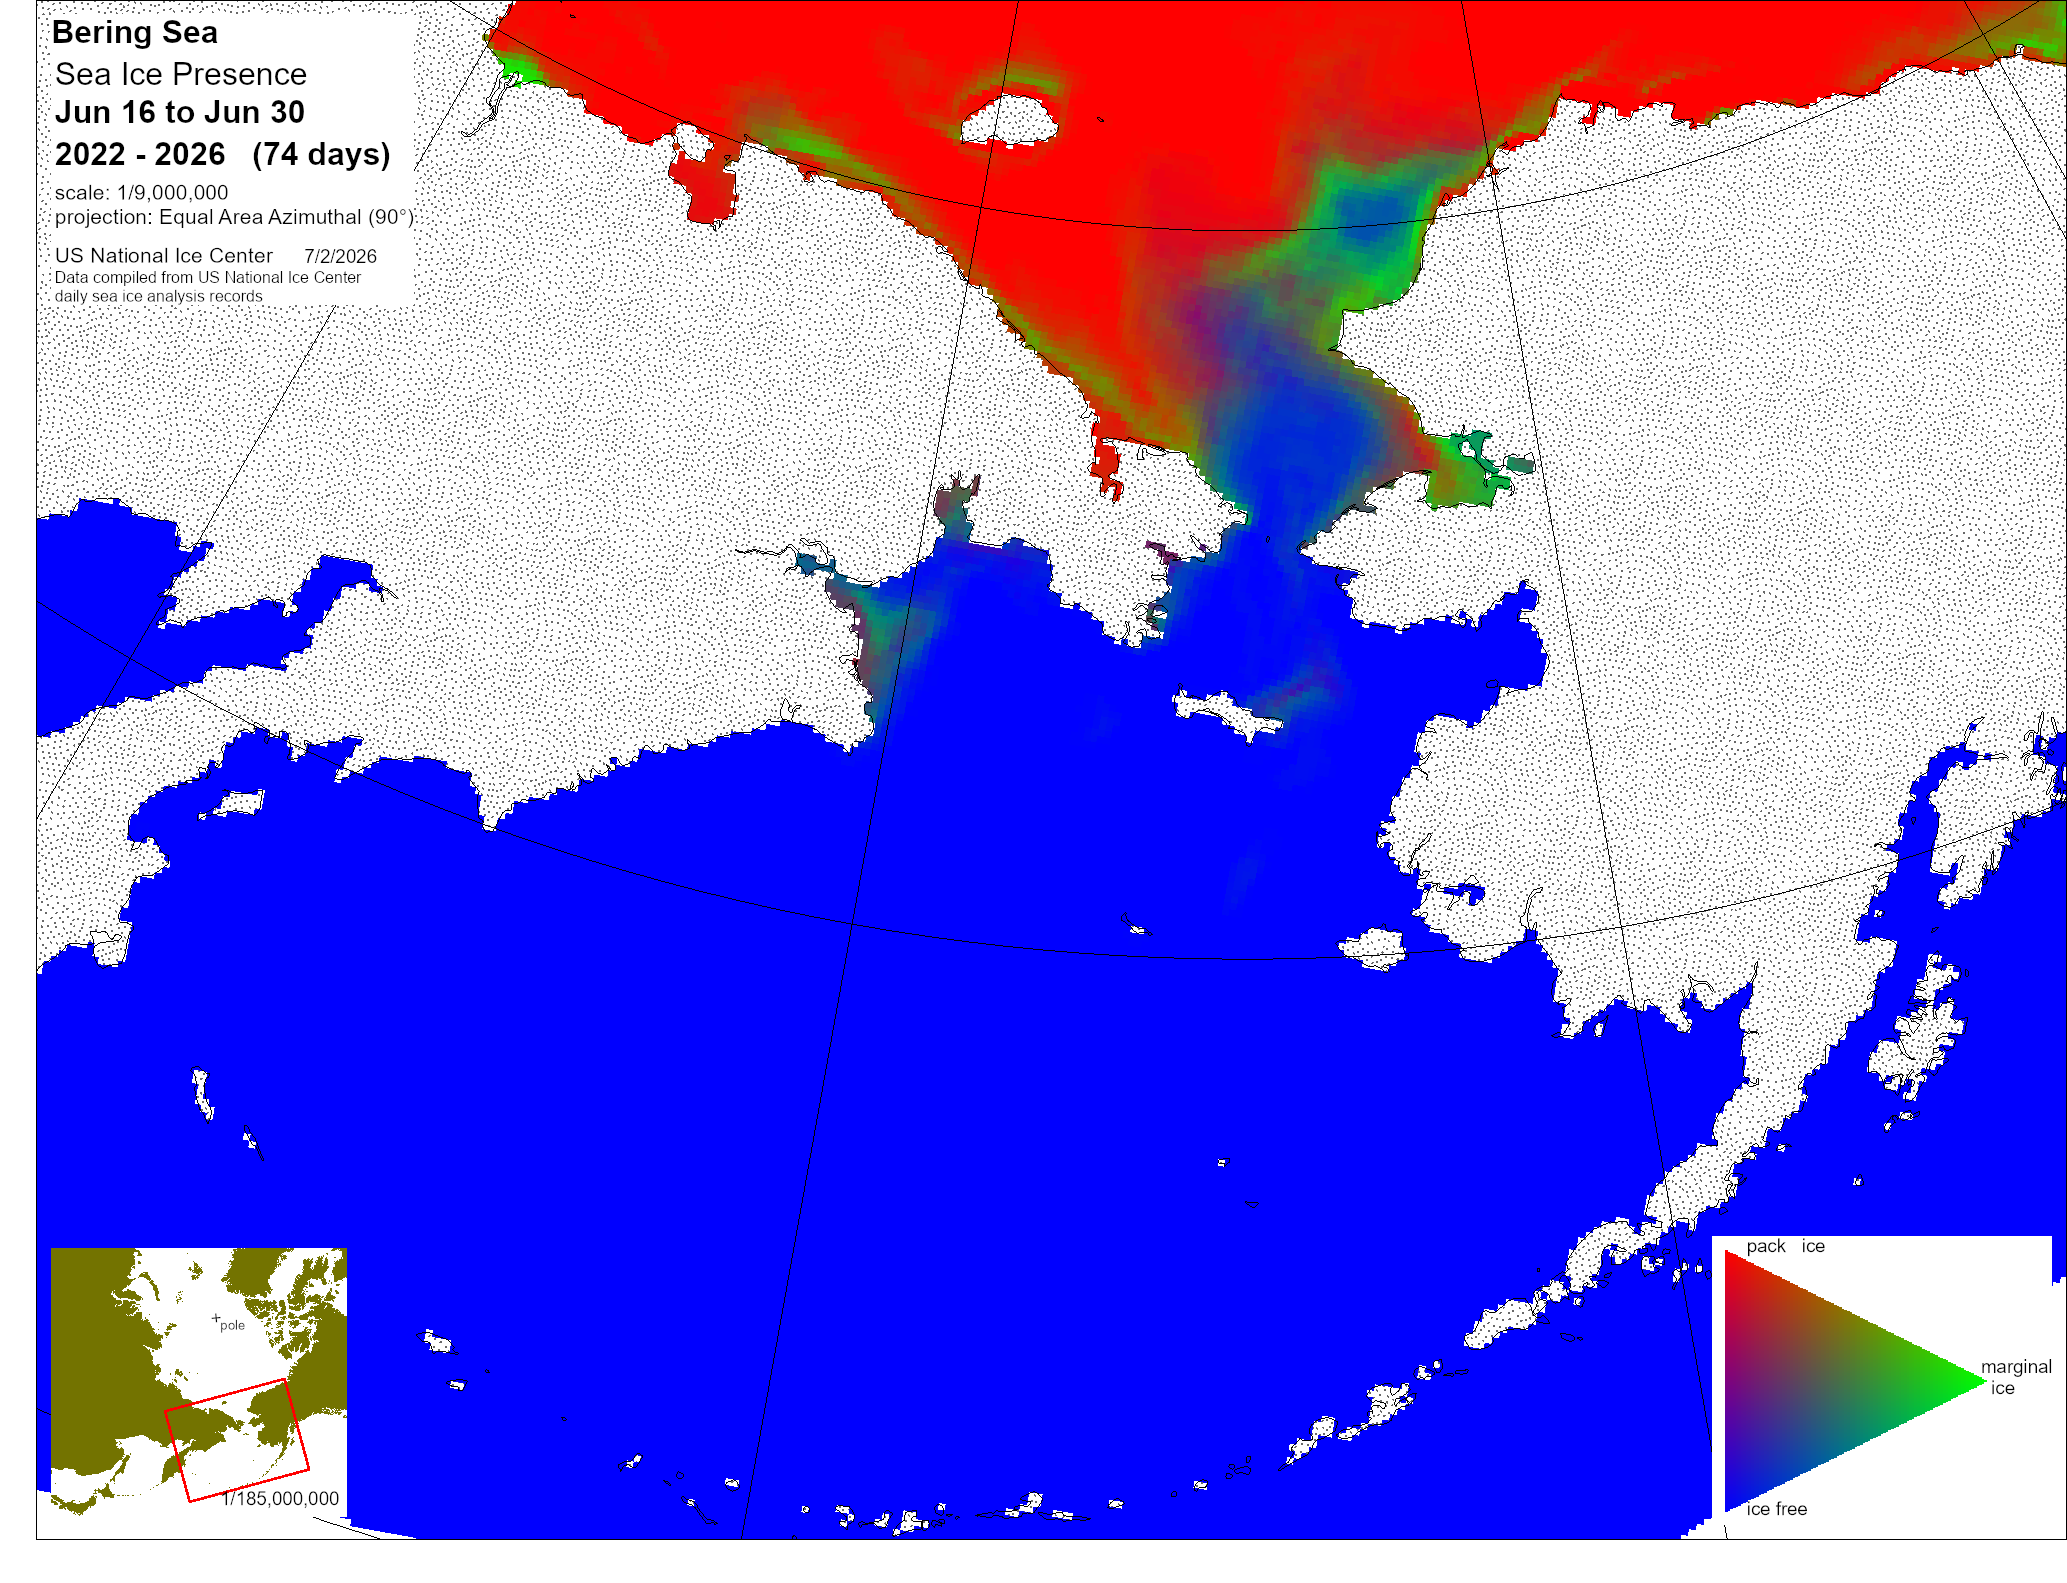
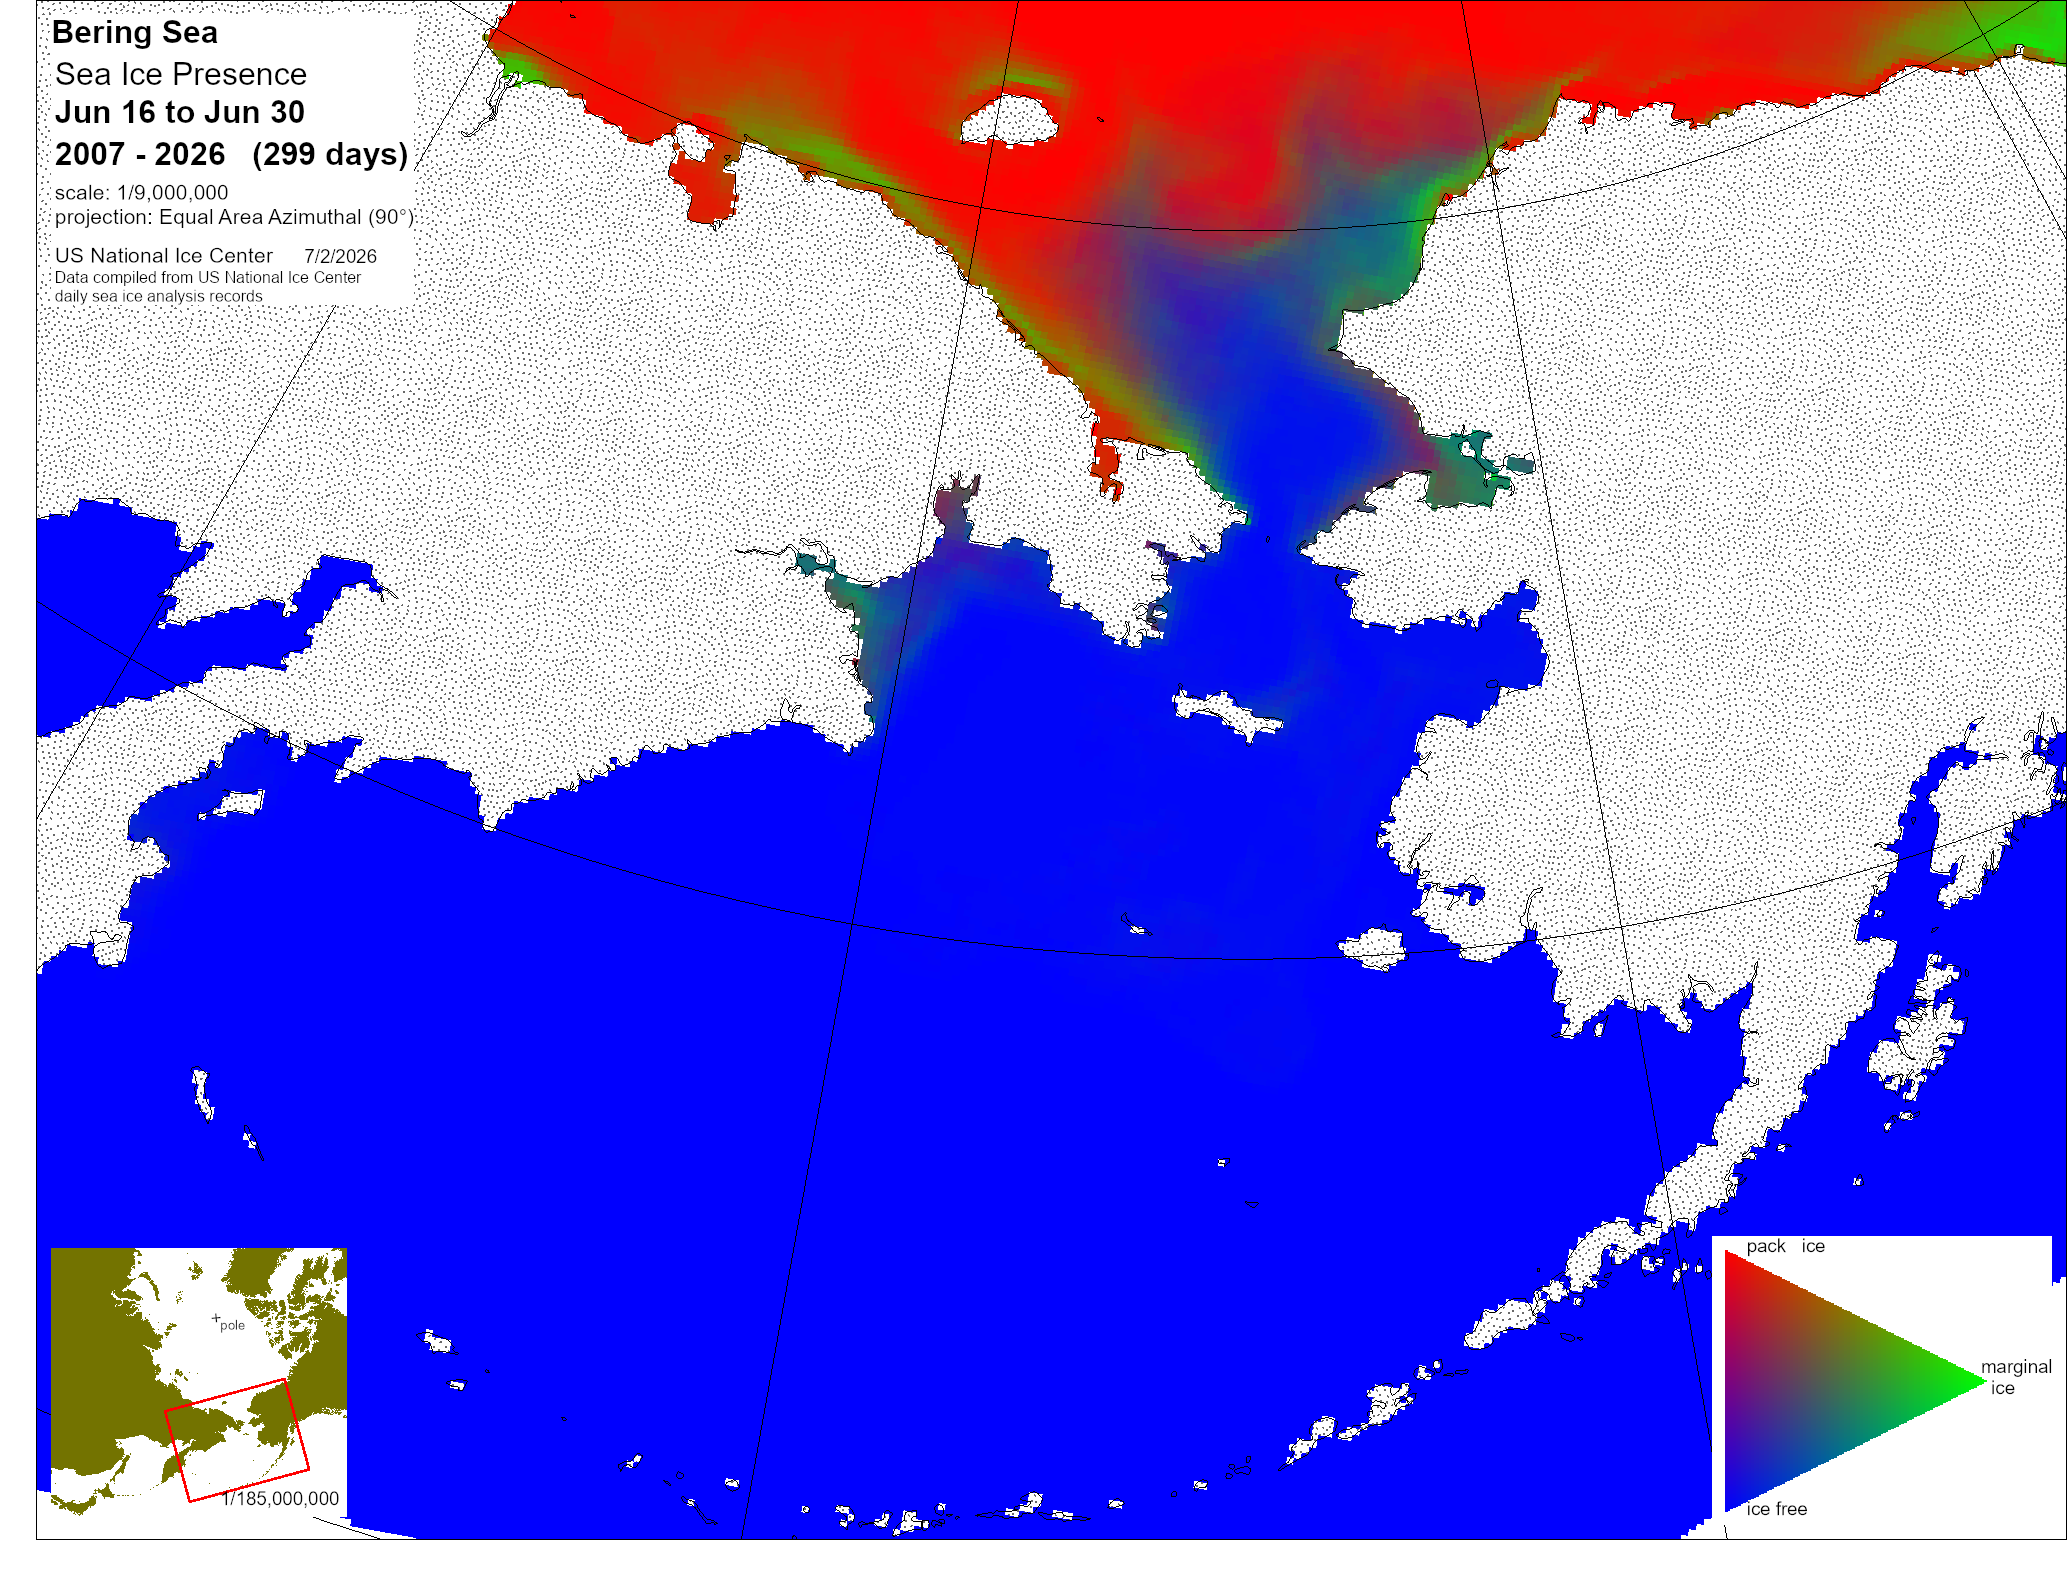
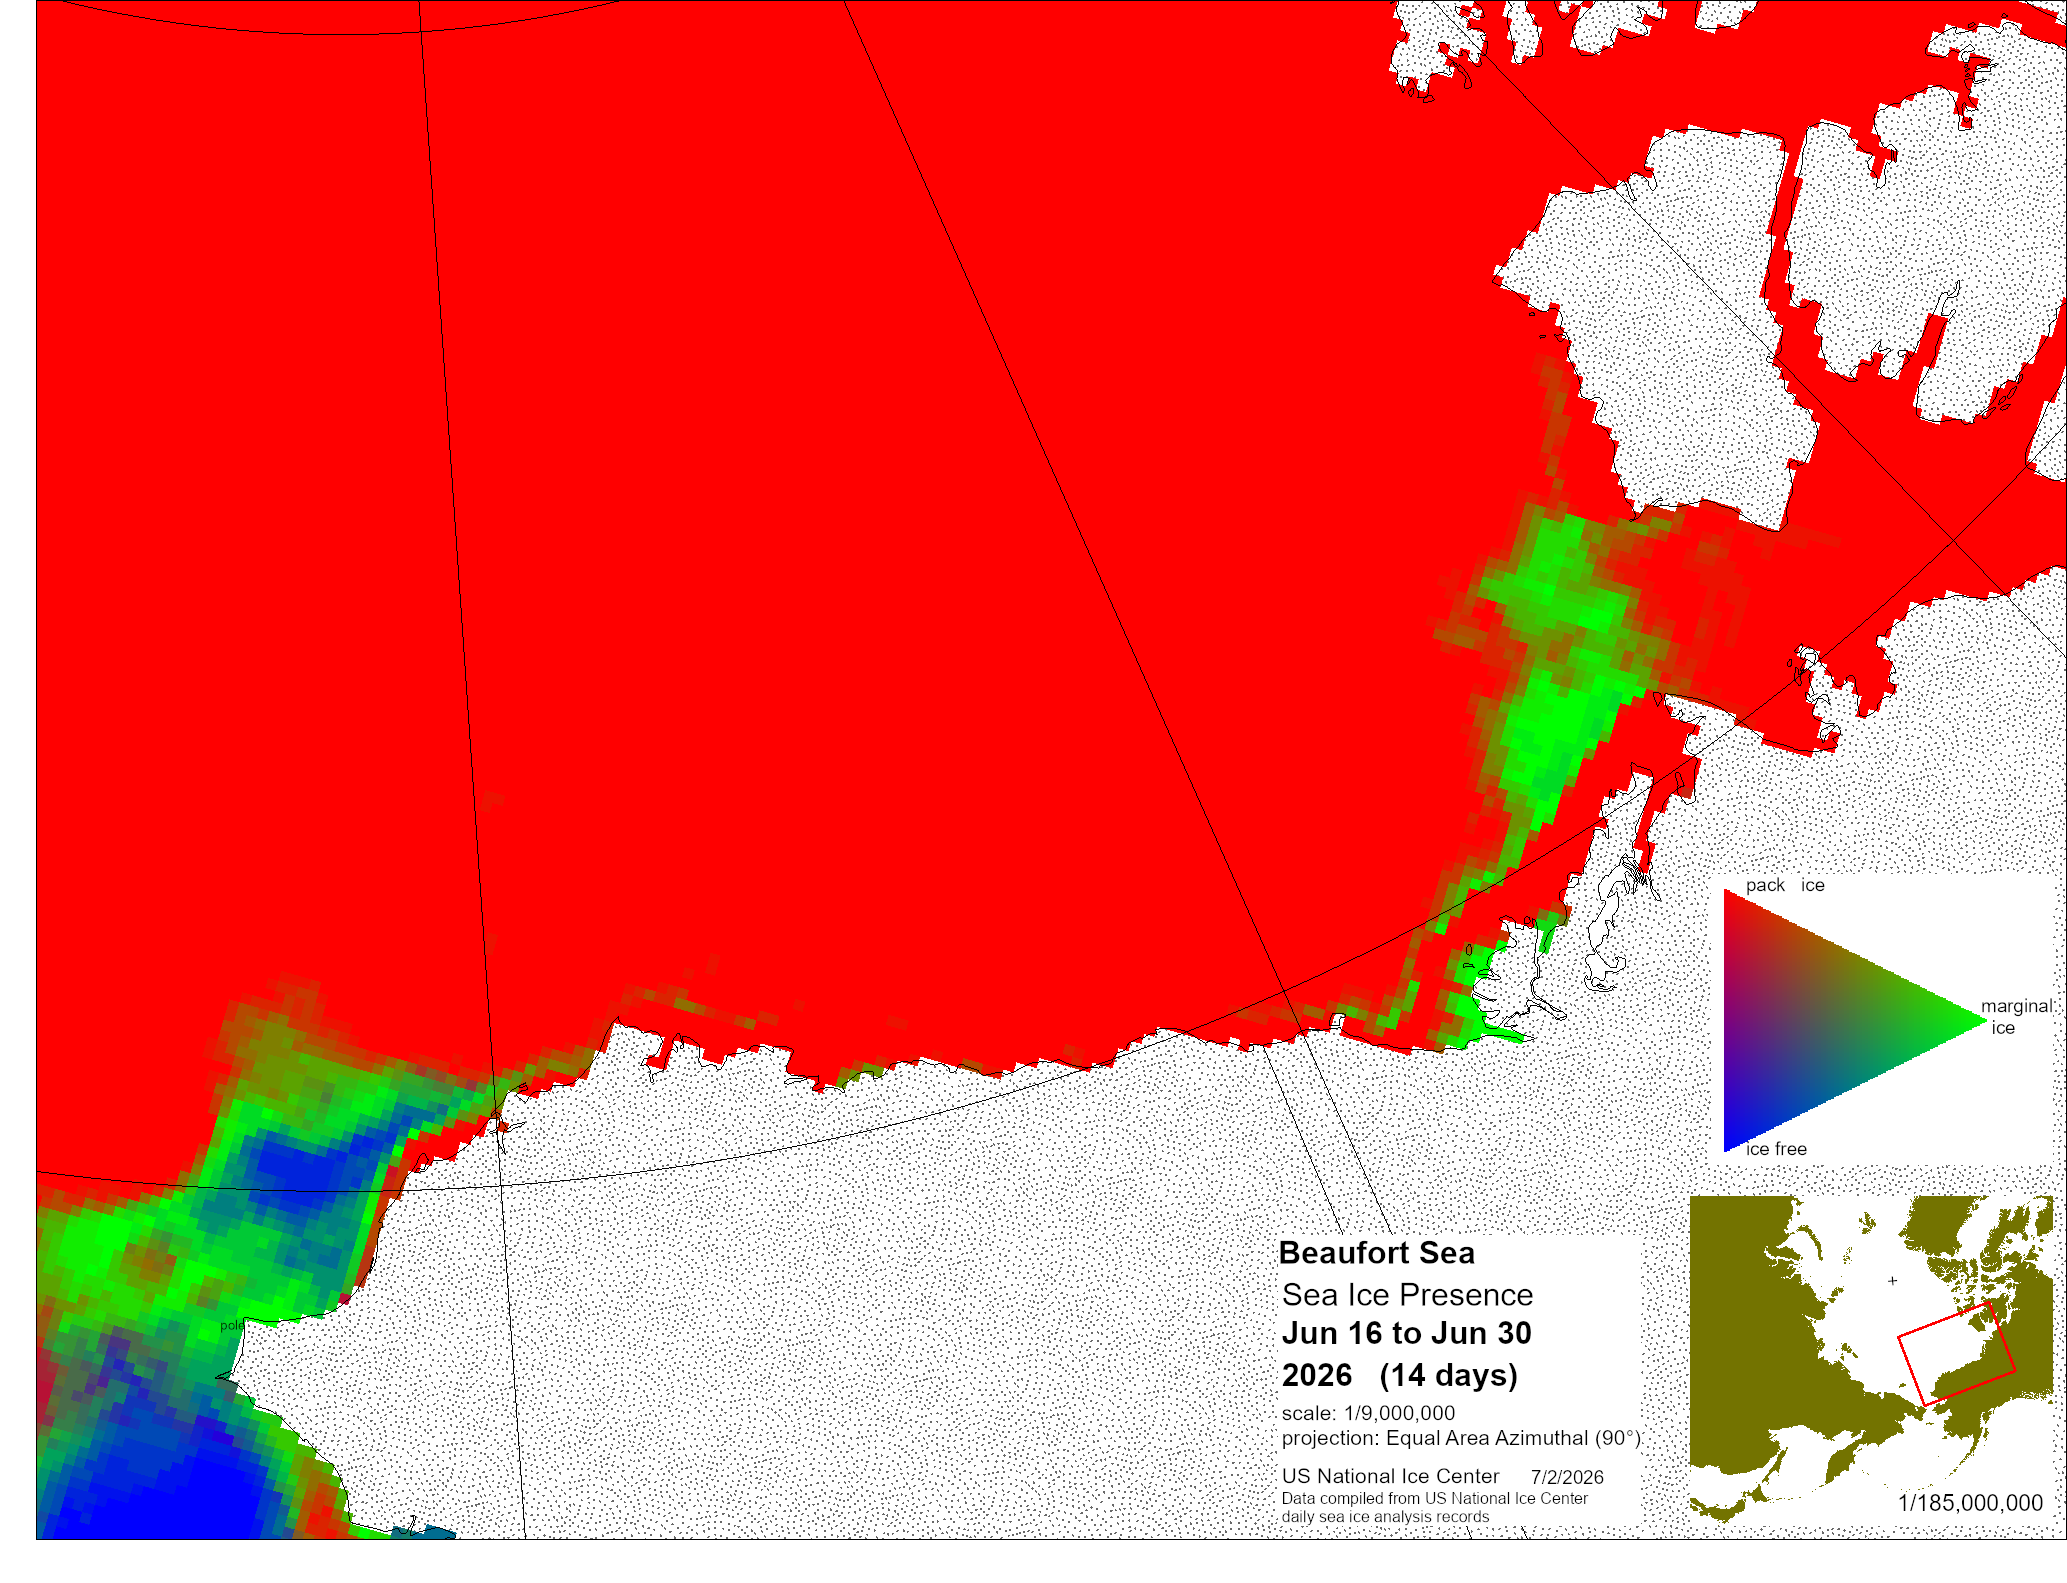
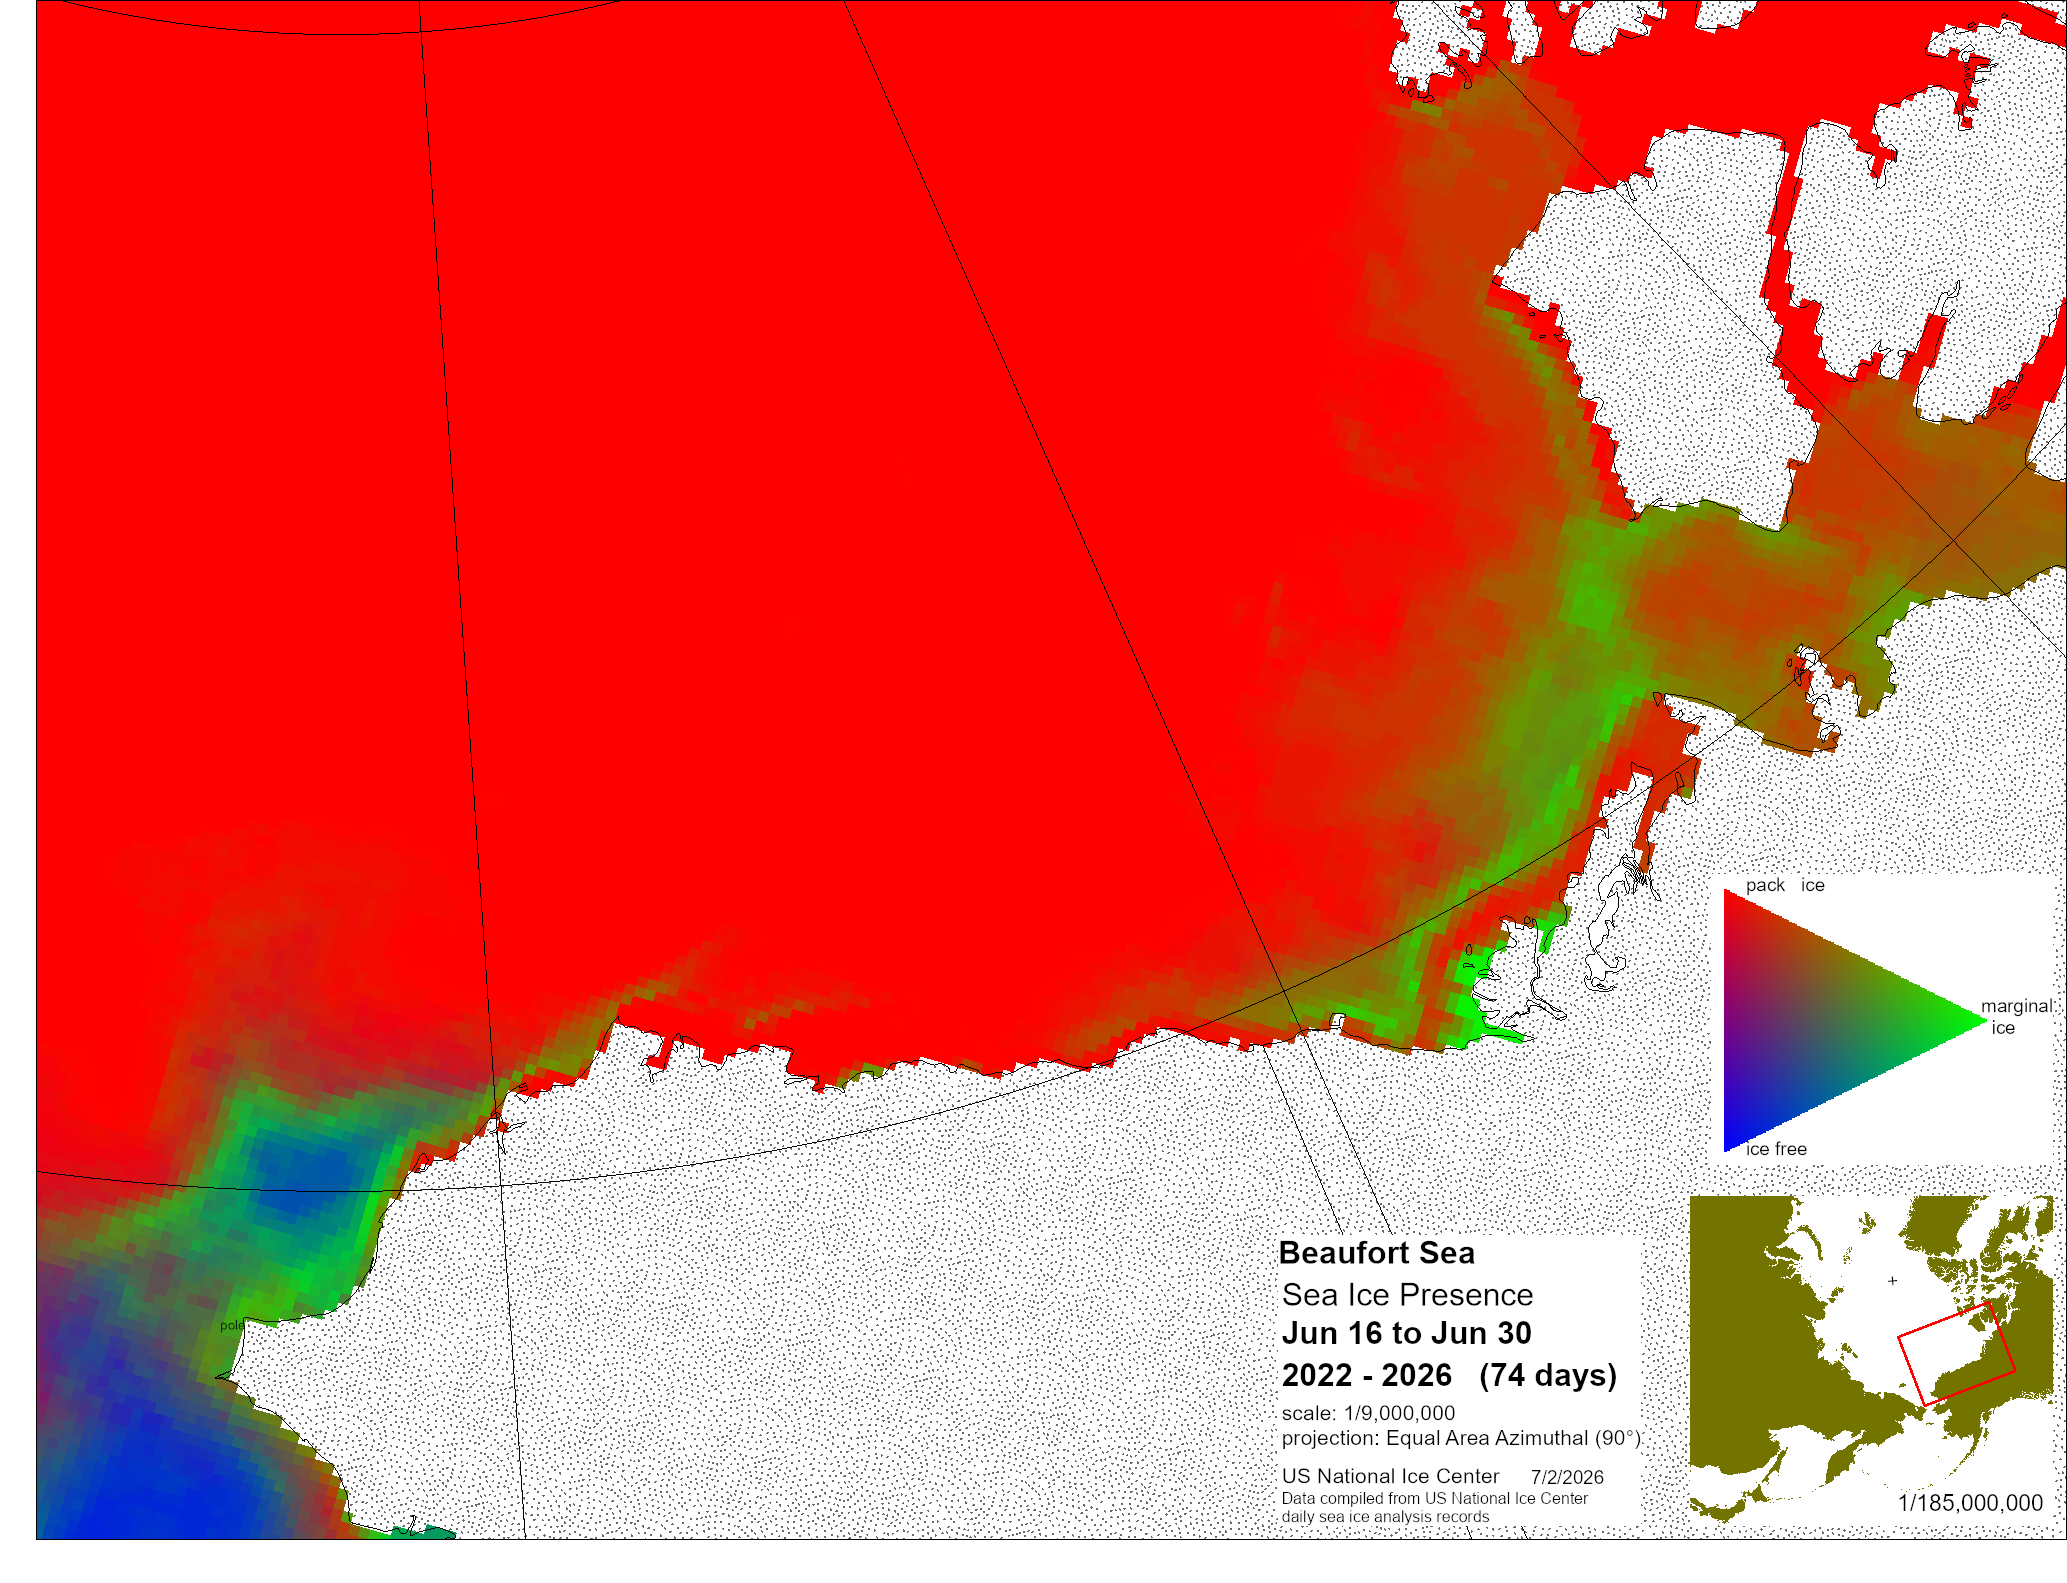
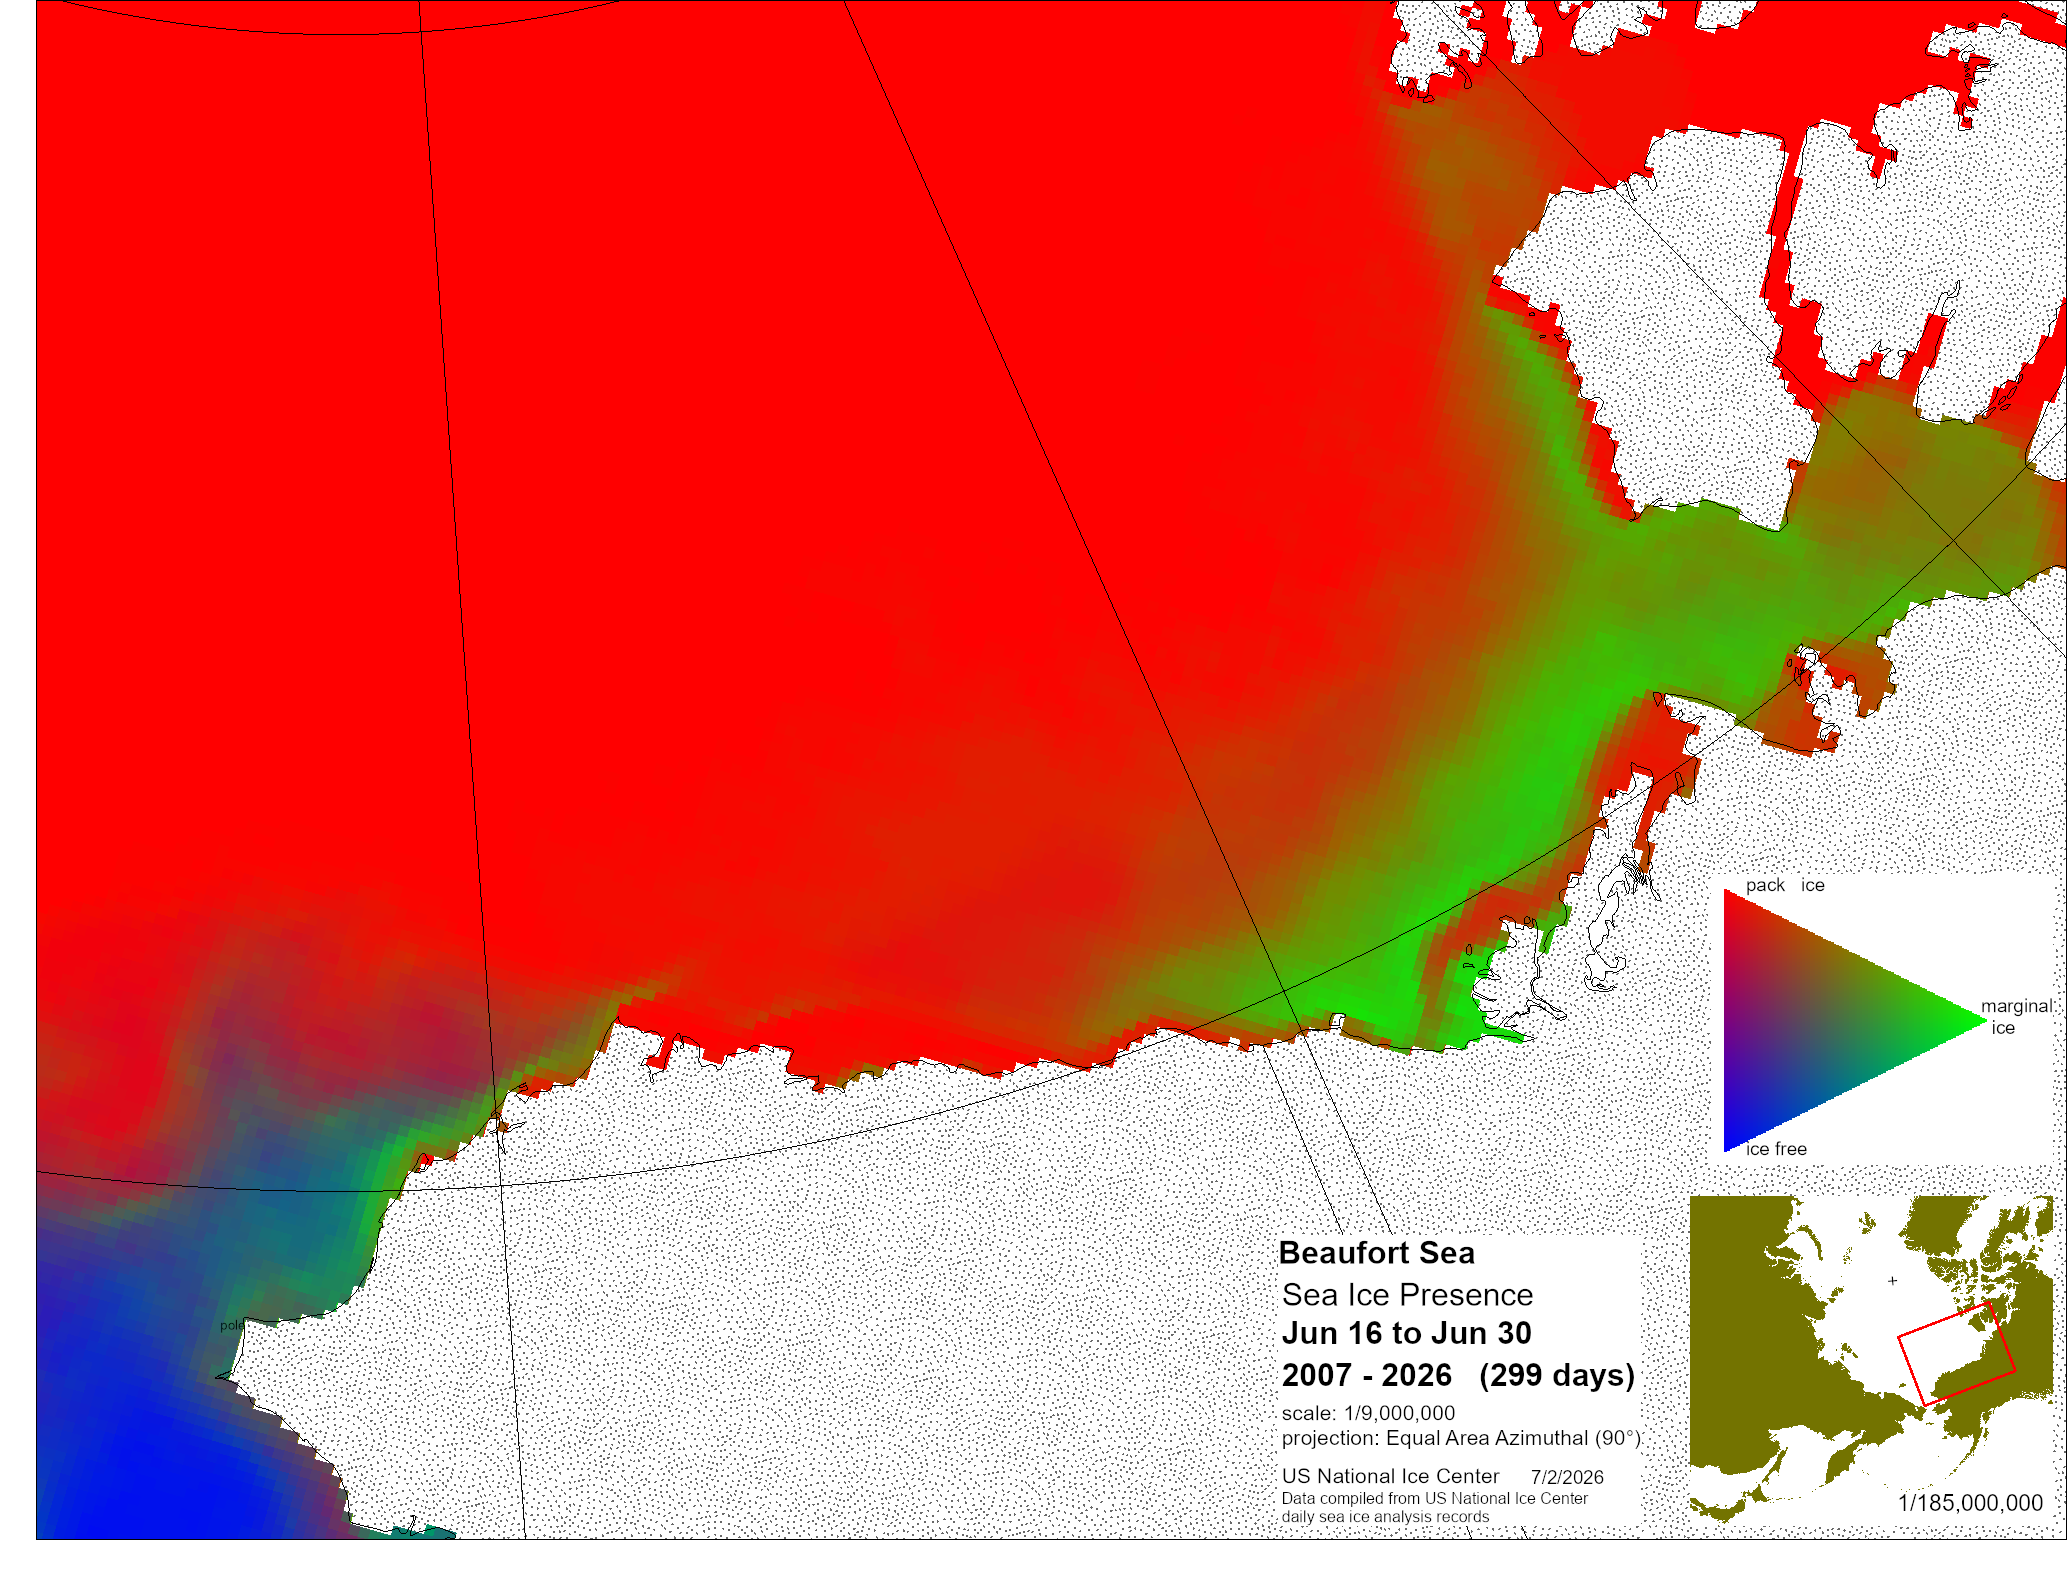
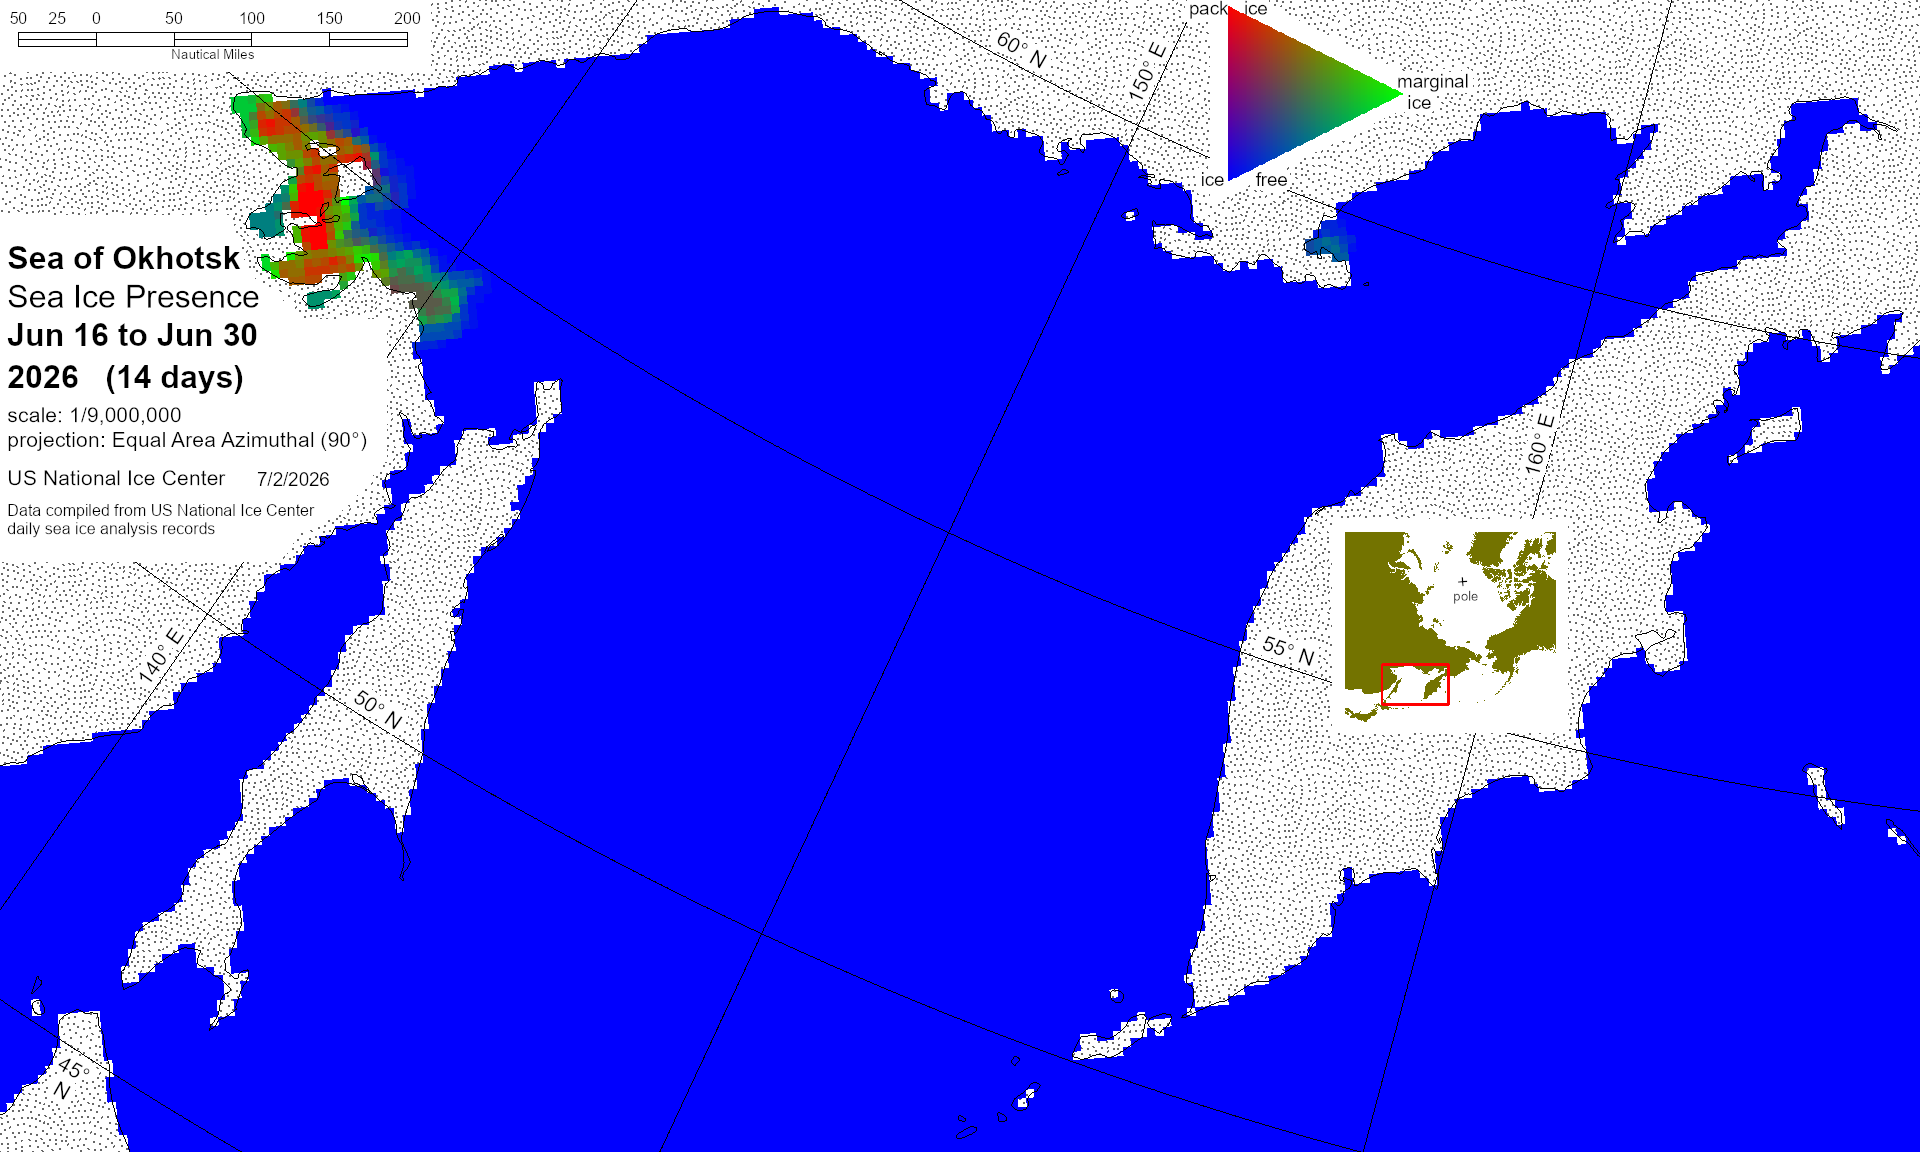
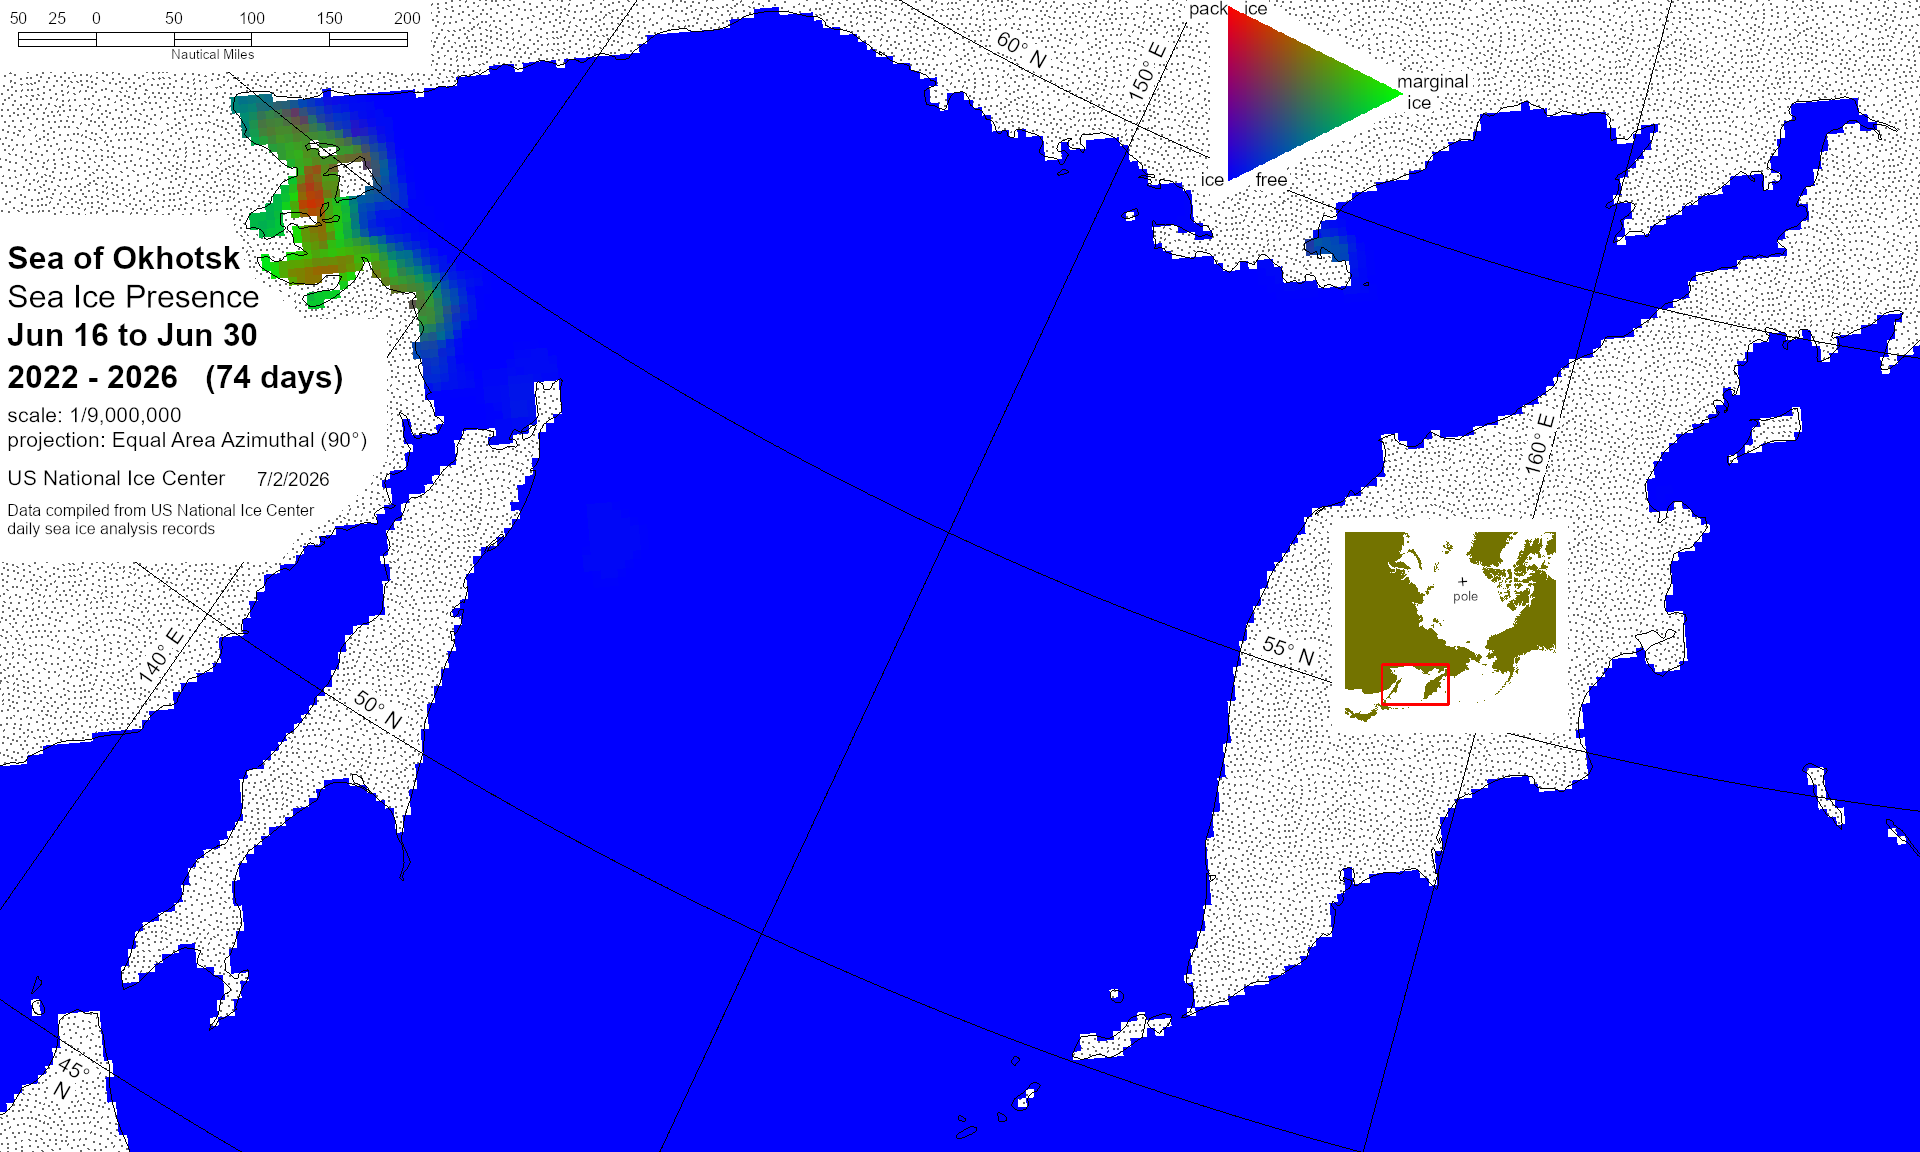
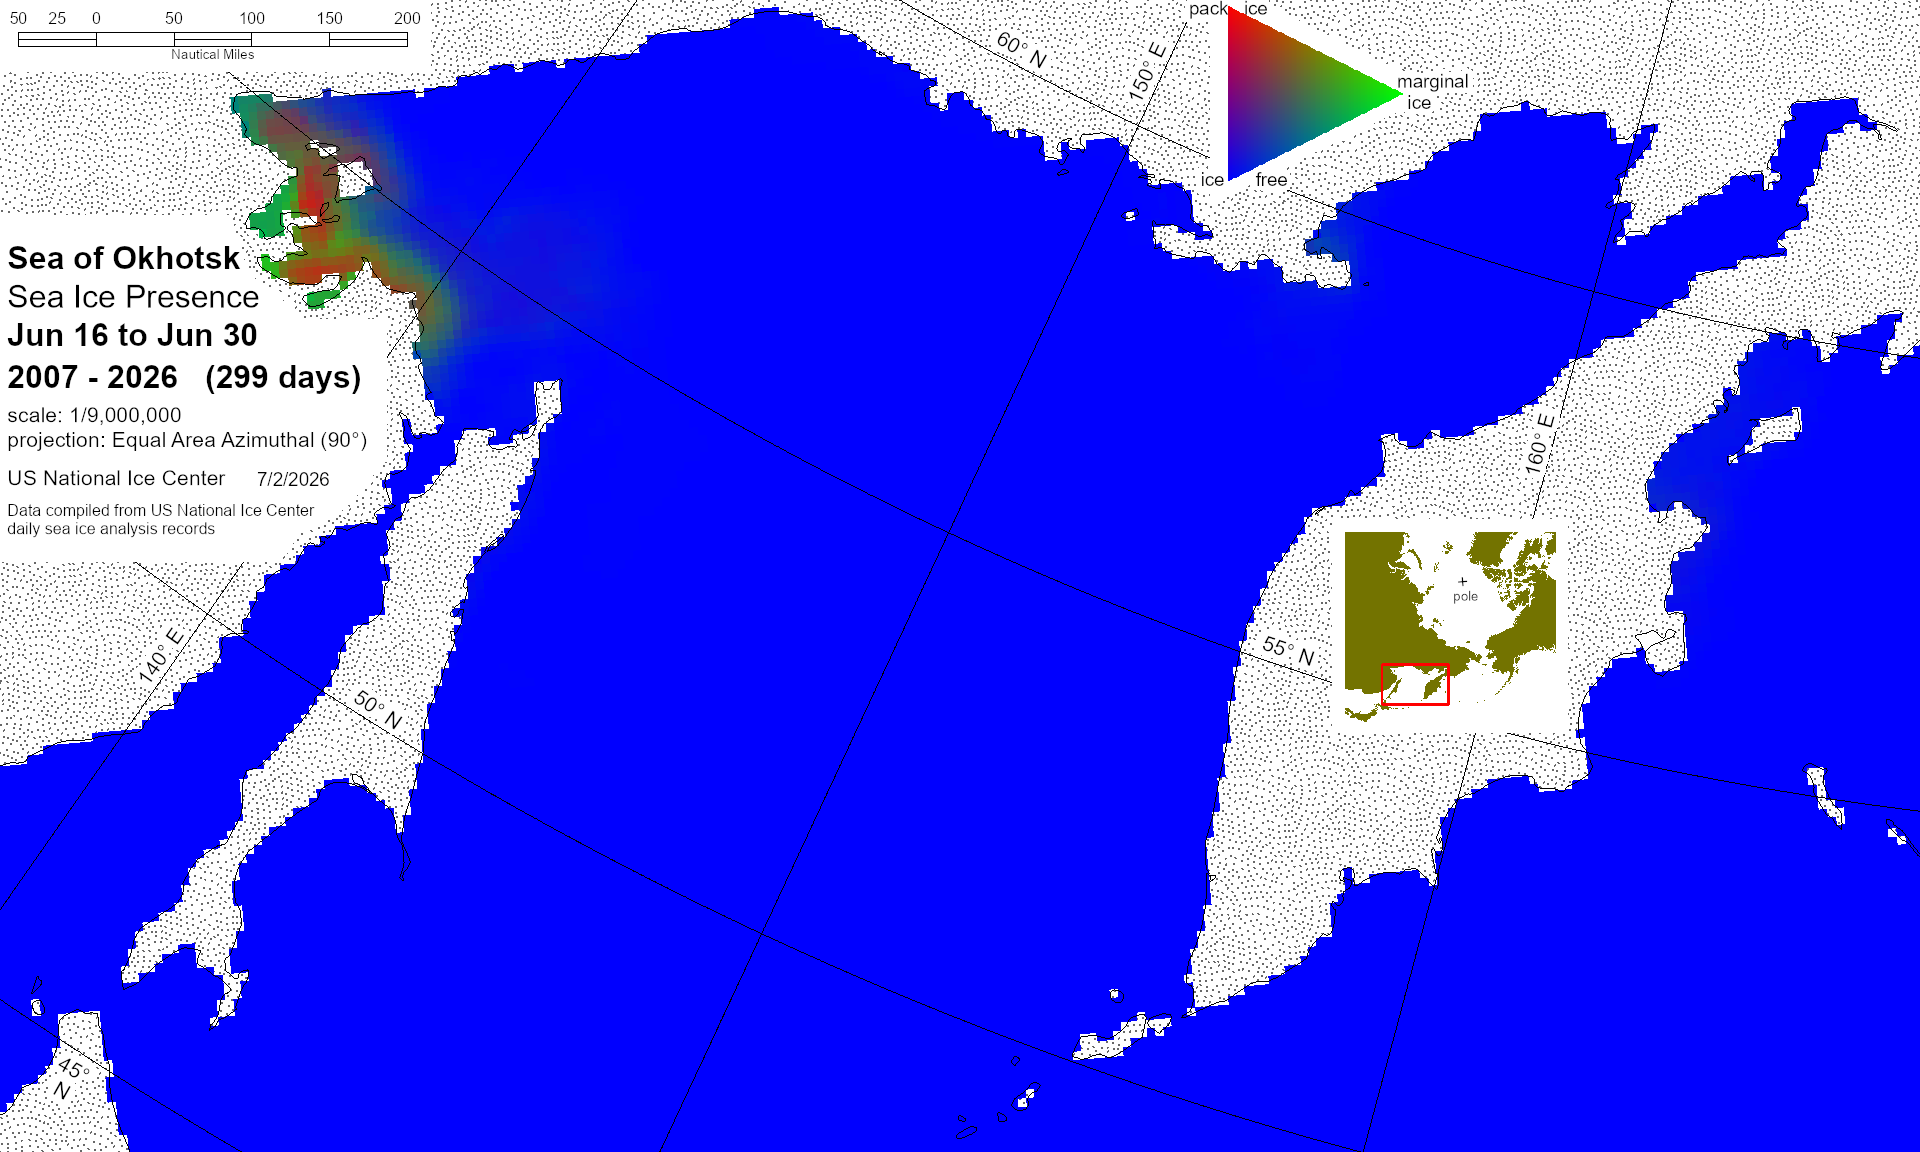
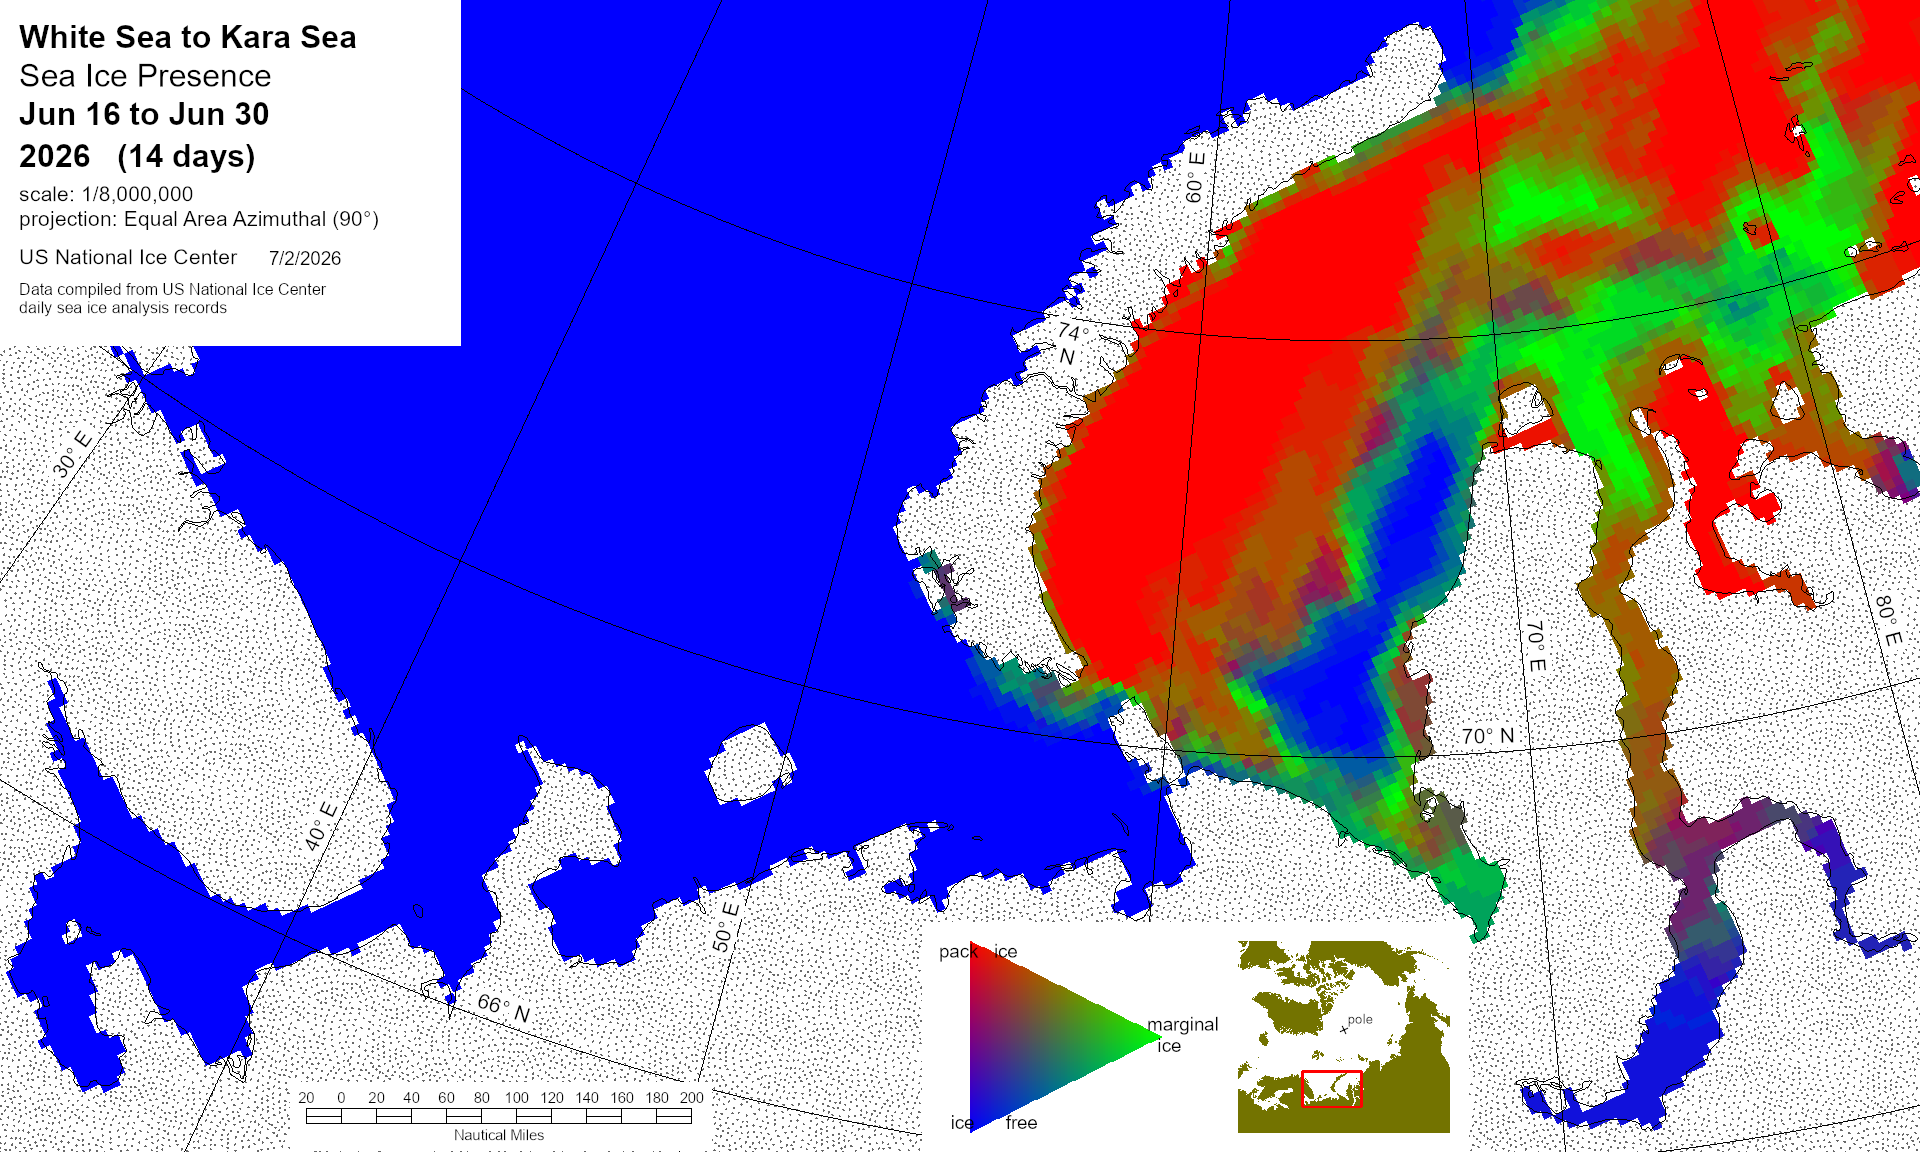
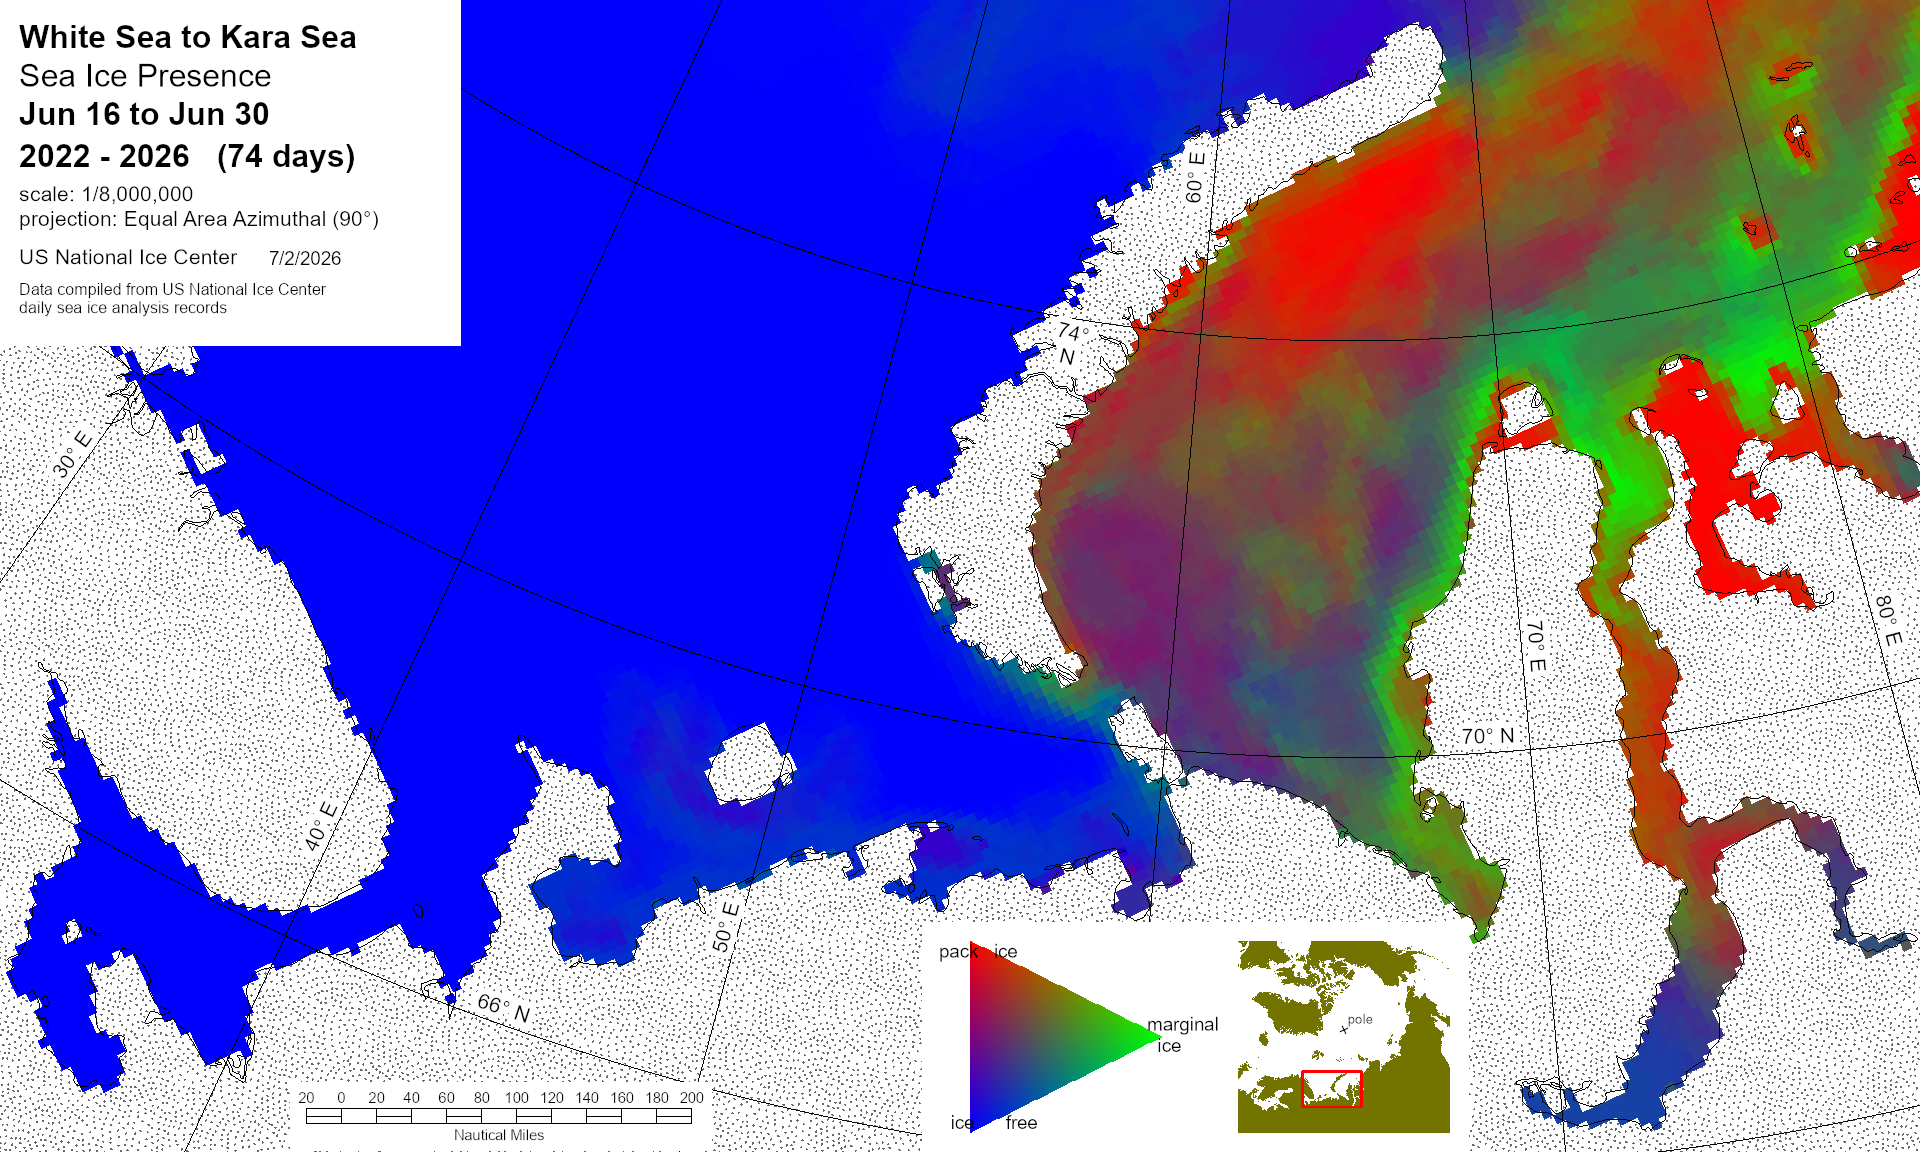
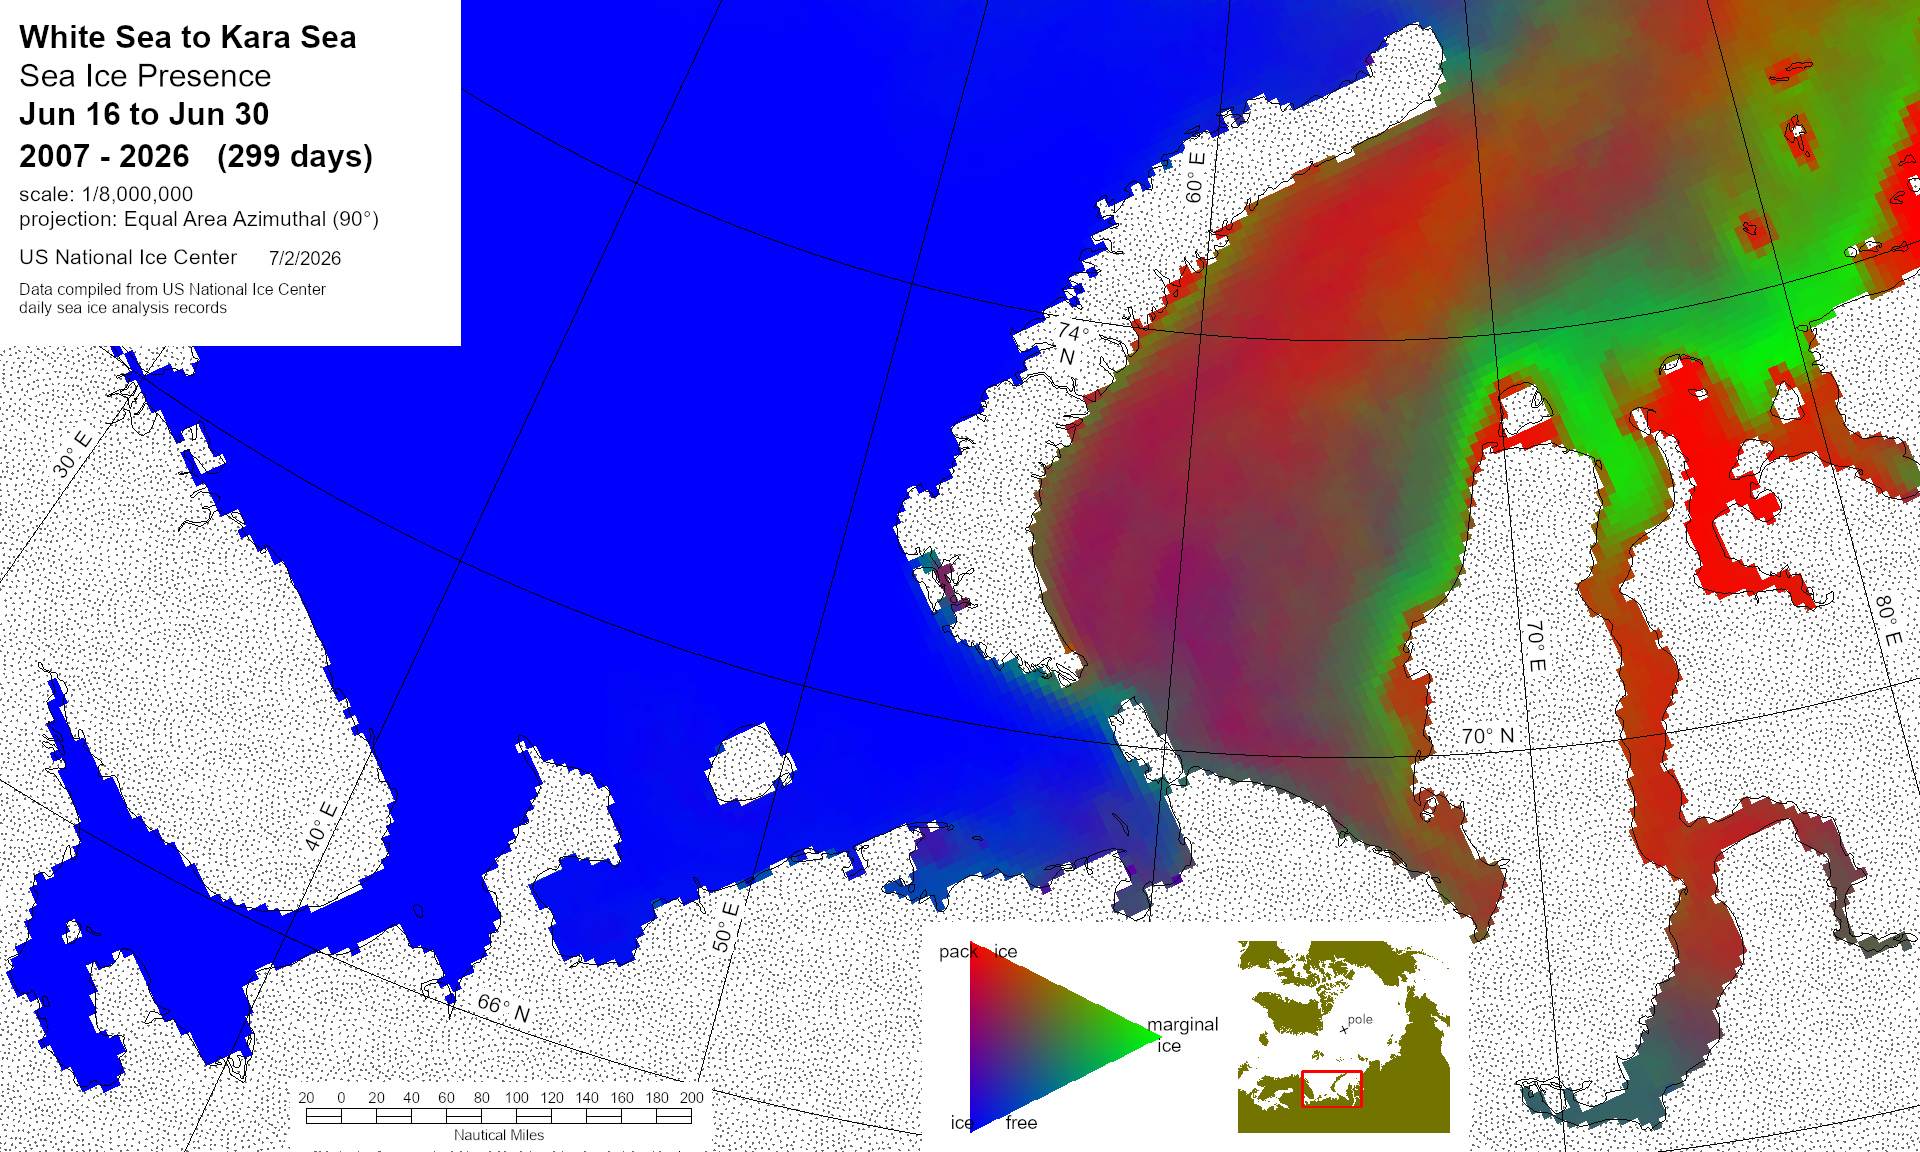
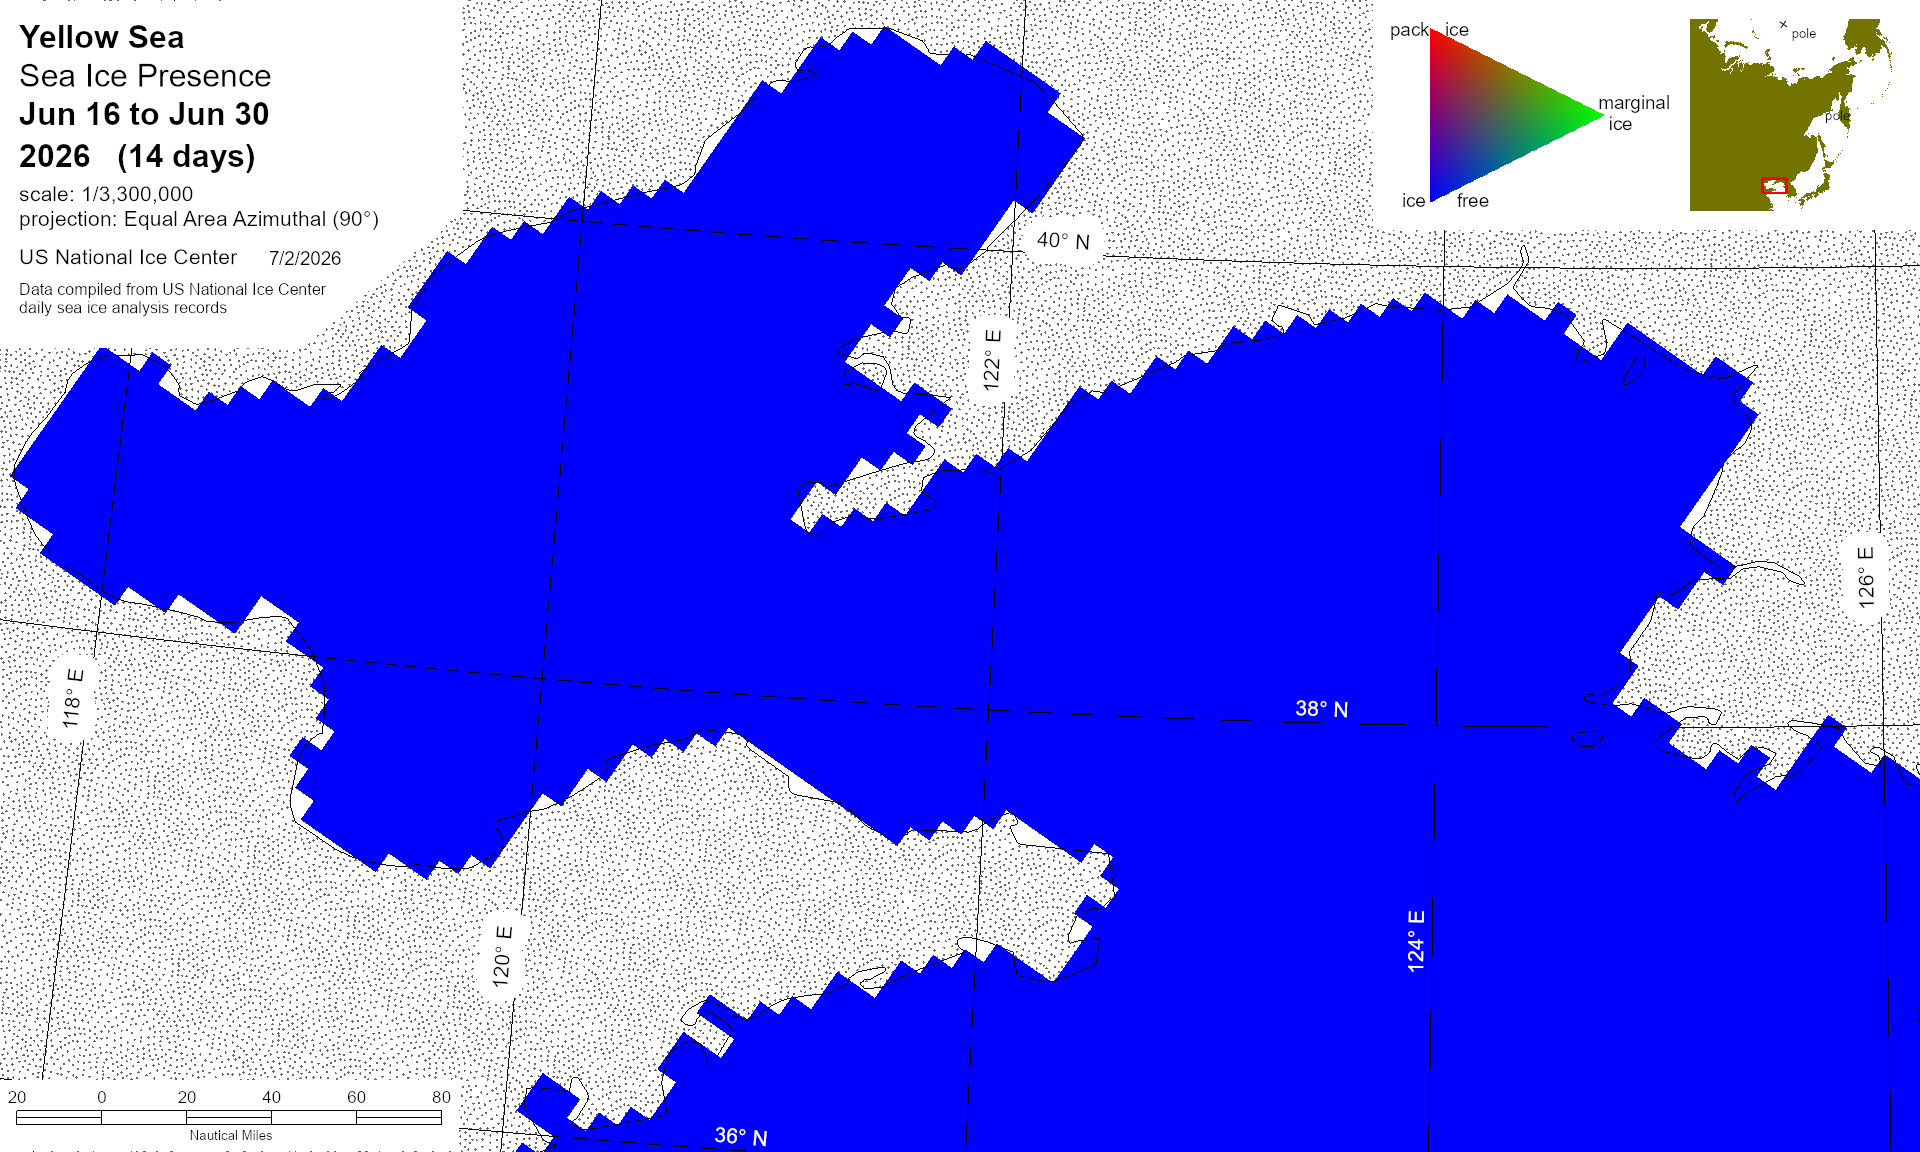
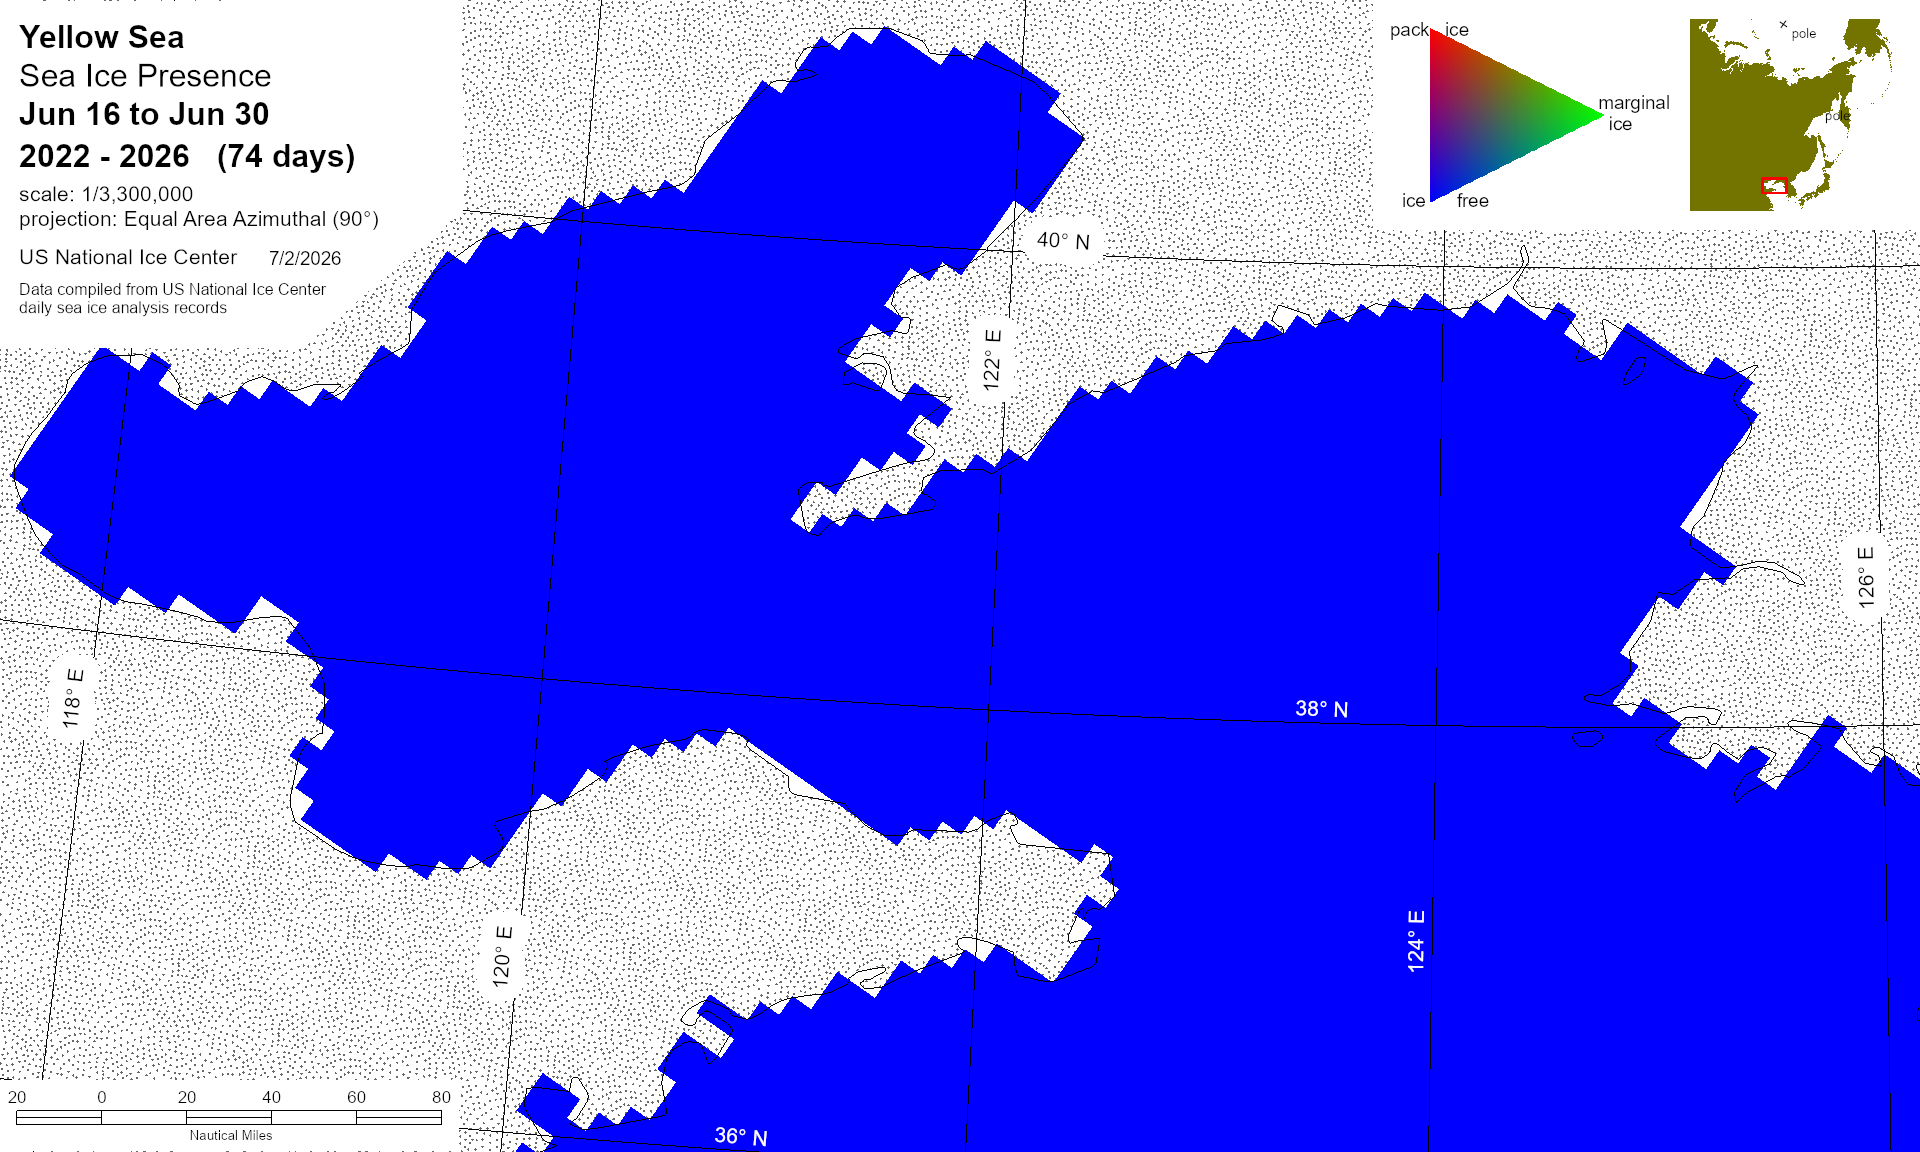
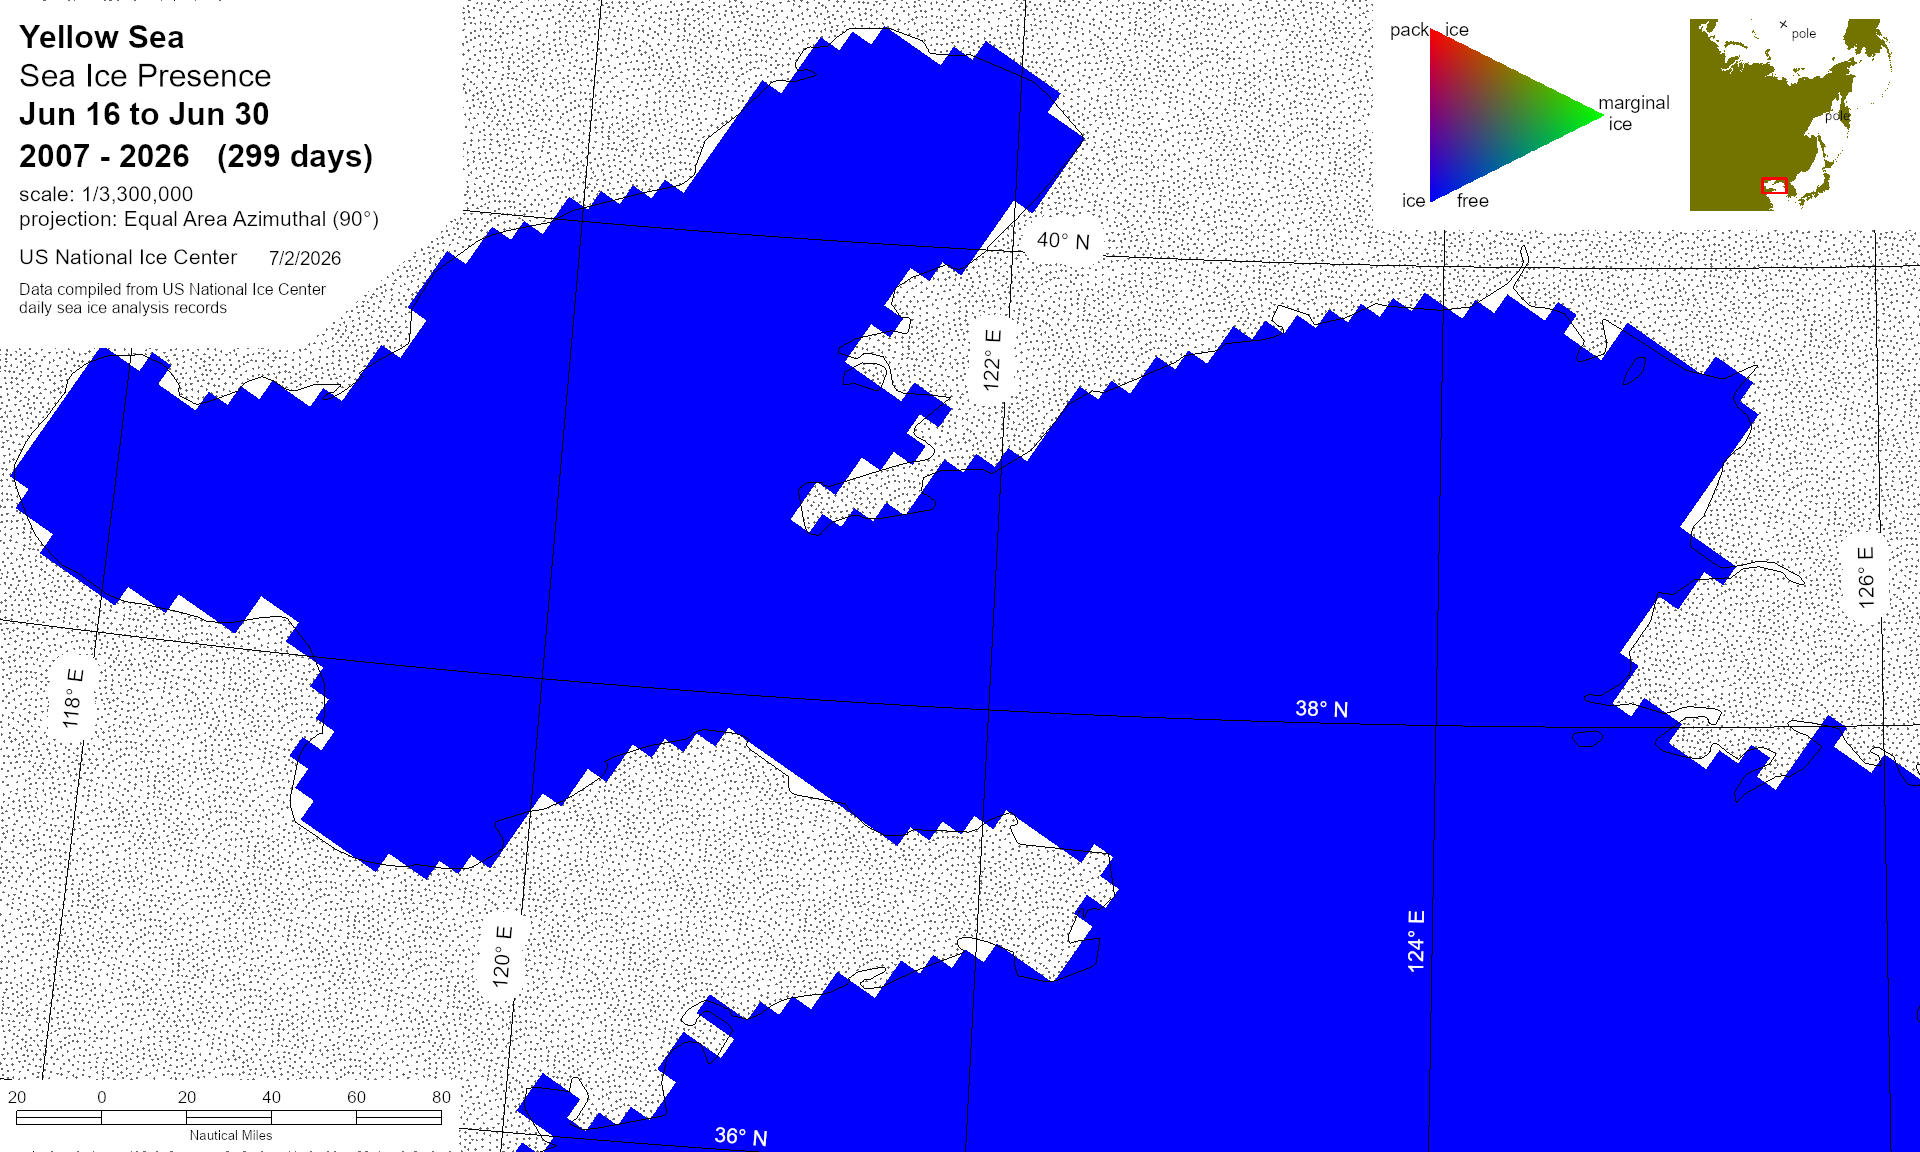
Arctic Trivariate products and data sets are derived from the U.S. National Ice Center archive data to provide an accurate, comprehensive, and easily understood characterization of analyzed sea ice conditions in the polar regions. The trivariate product characterizes ice coverage over time; in this case in half-month time blocks. The Single Year data shows conditions during the stated period for the year indicated. Compendium Year maps show a diachronic view of the sea ice for the stated half-month period in all years from 2007 to the date noted. For more information, please visit our Trivariate information page.
Area
Description
Display / Format
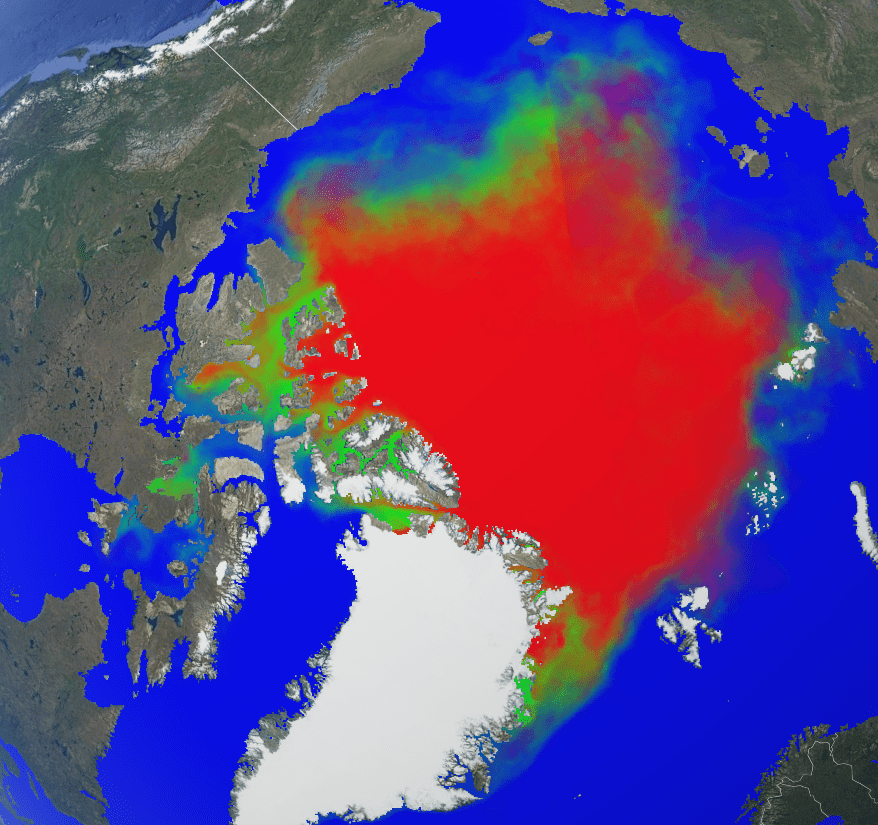
Arctic Trivariate KMZ
KMZ file that covers ice information contained throughout the entire Arctic region. For color legend, please click here.
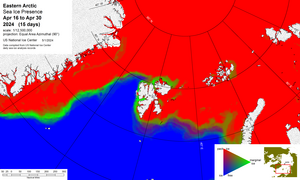
East Arctic Trivariate
Graphic representation of ice information gathered over a specified time that is contained within the Eastern Arctic boundaries.
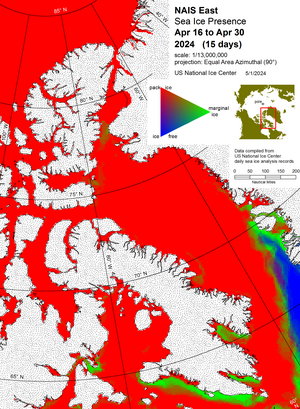
NAIS East Arctic Trivariate
Graphic representation of ice information gathered over a specified time that is contained within the NAIS Eastern Arctic boundaries.
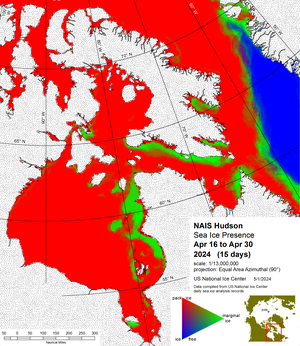
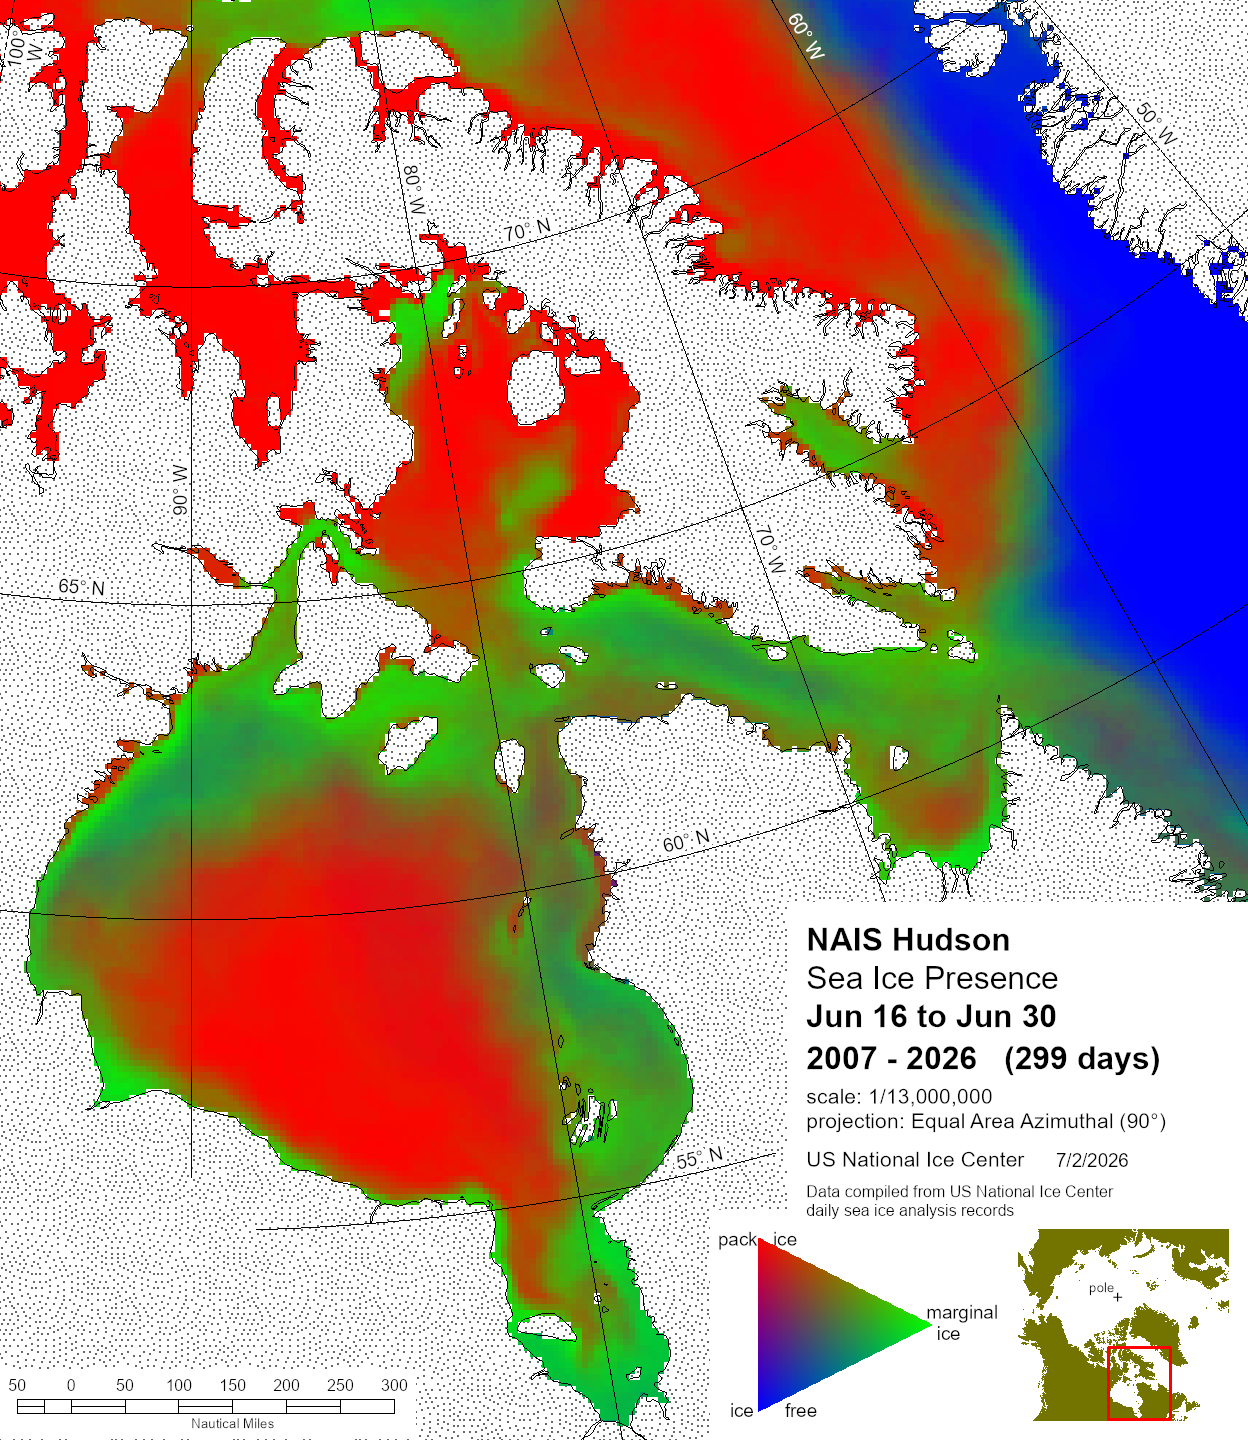
NAIS Hudson Bay Trivariate
Graphic representation of ice information gathered over a specified time that is contained within the NAIS Hudson Bay region.
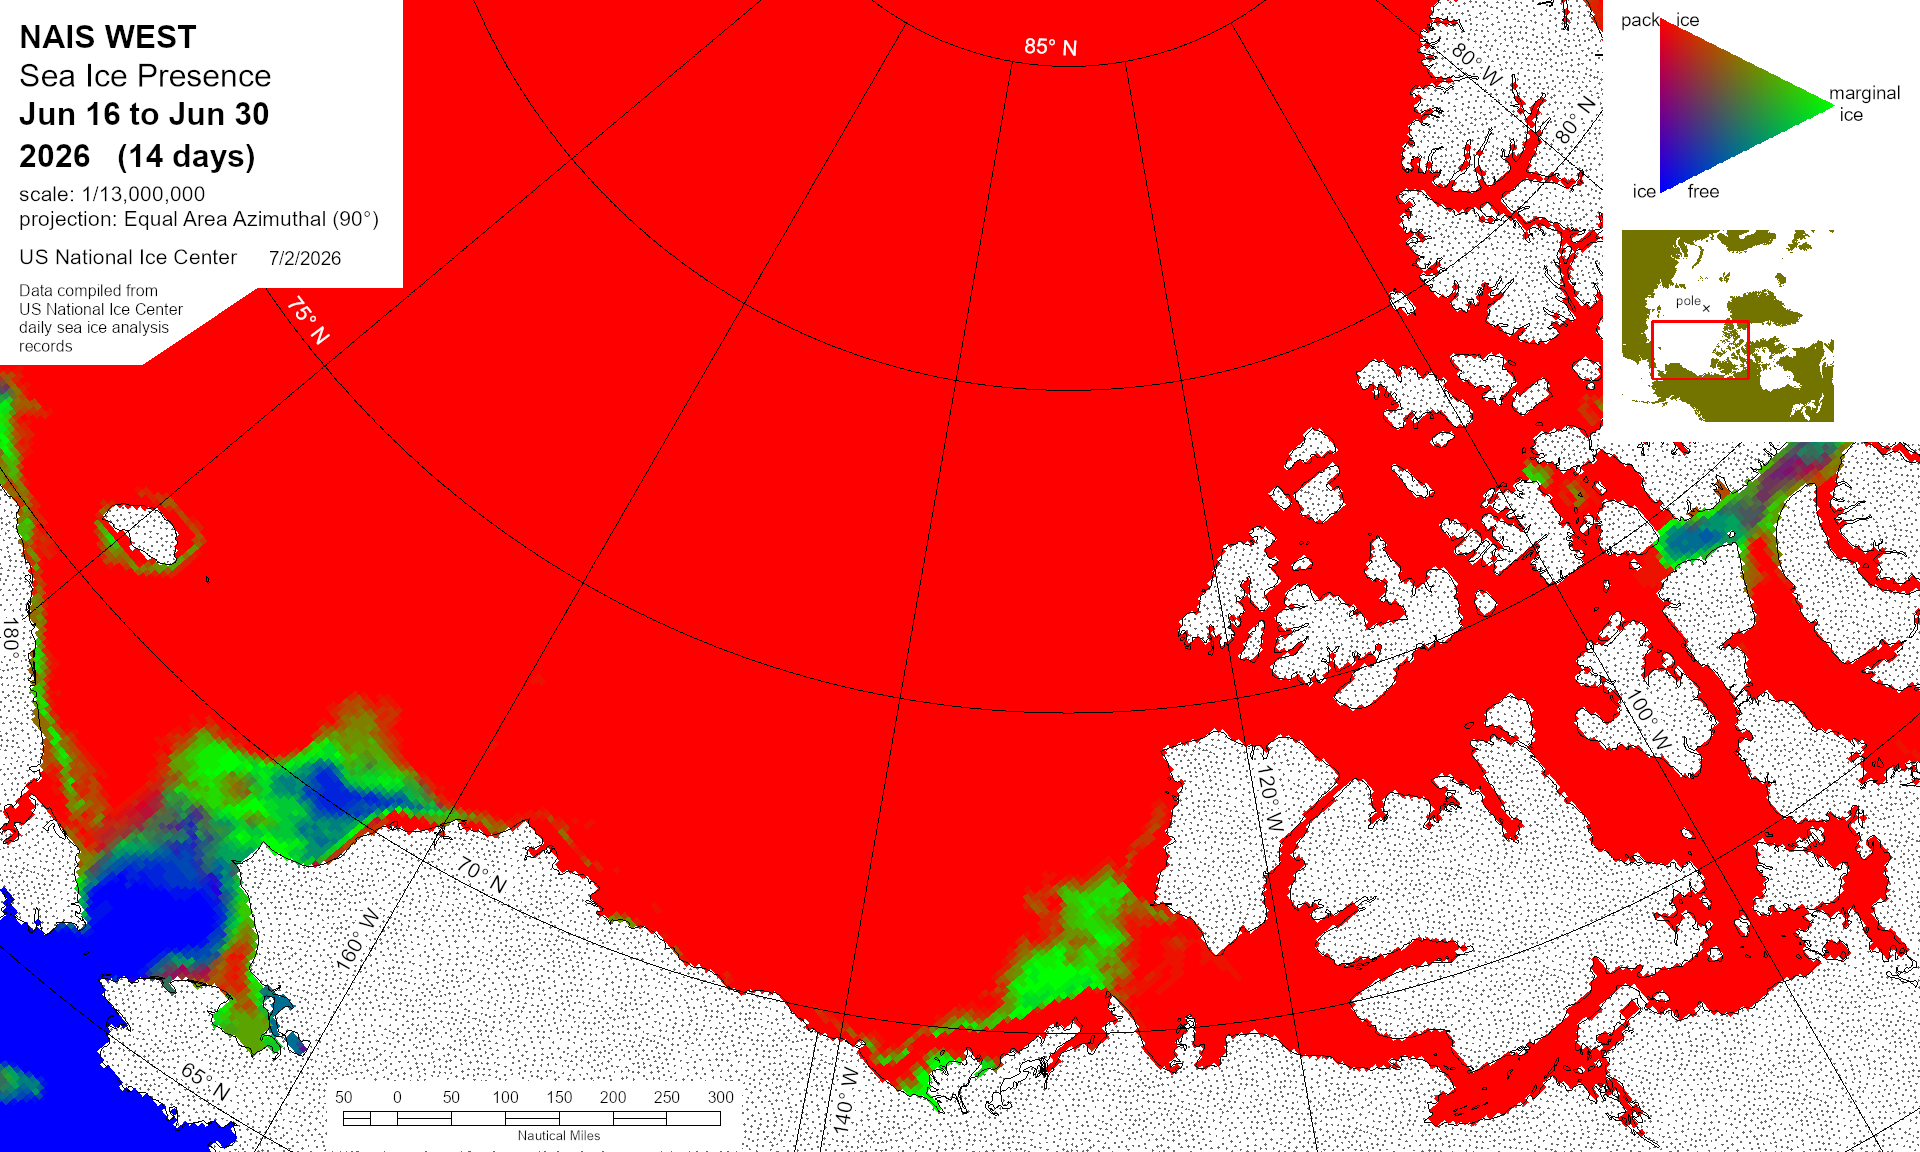
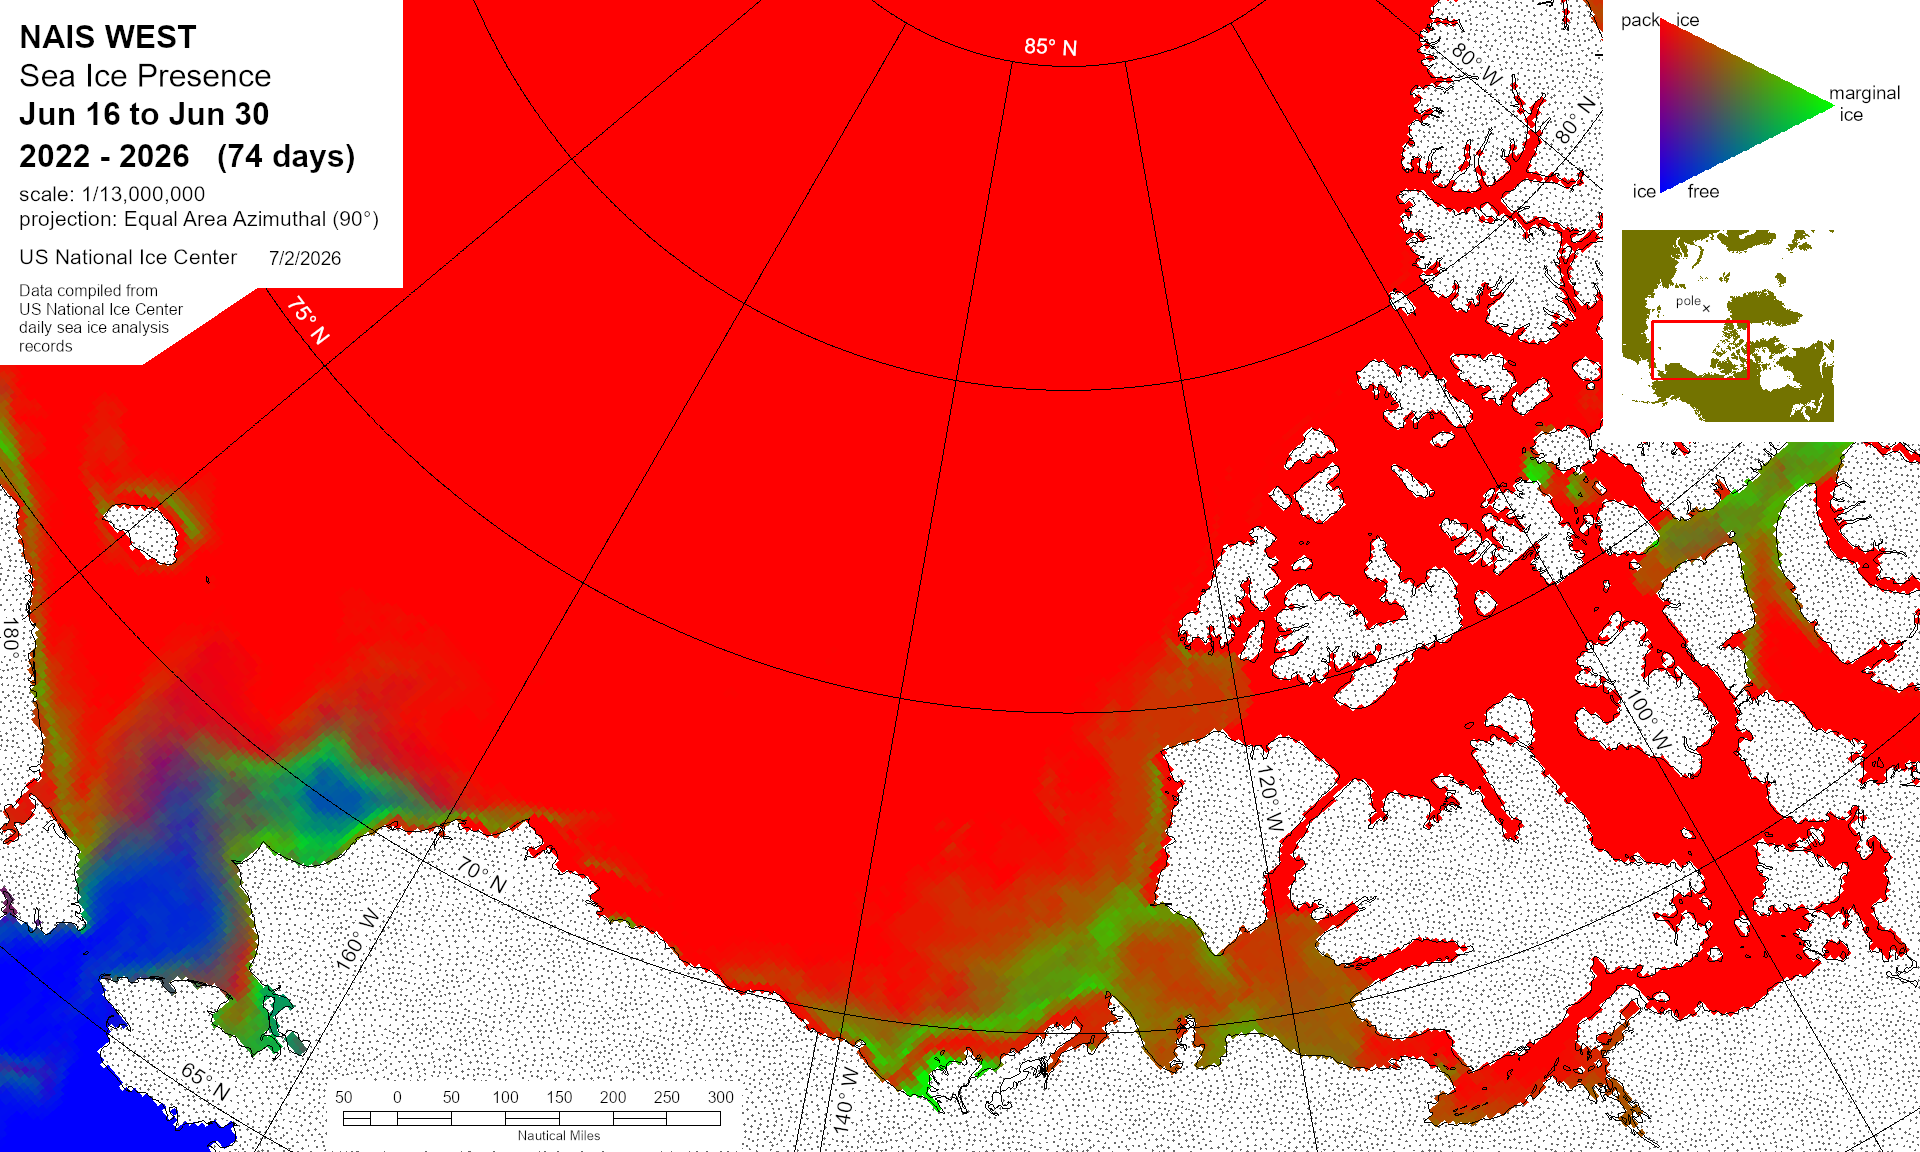
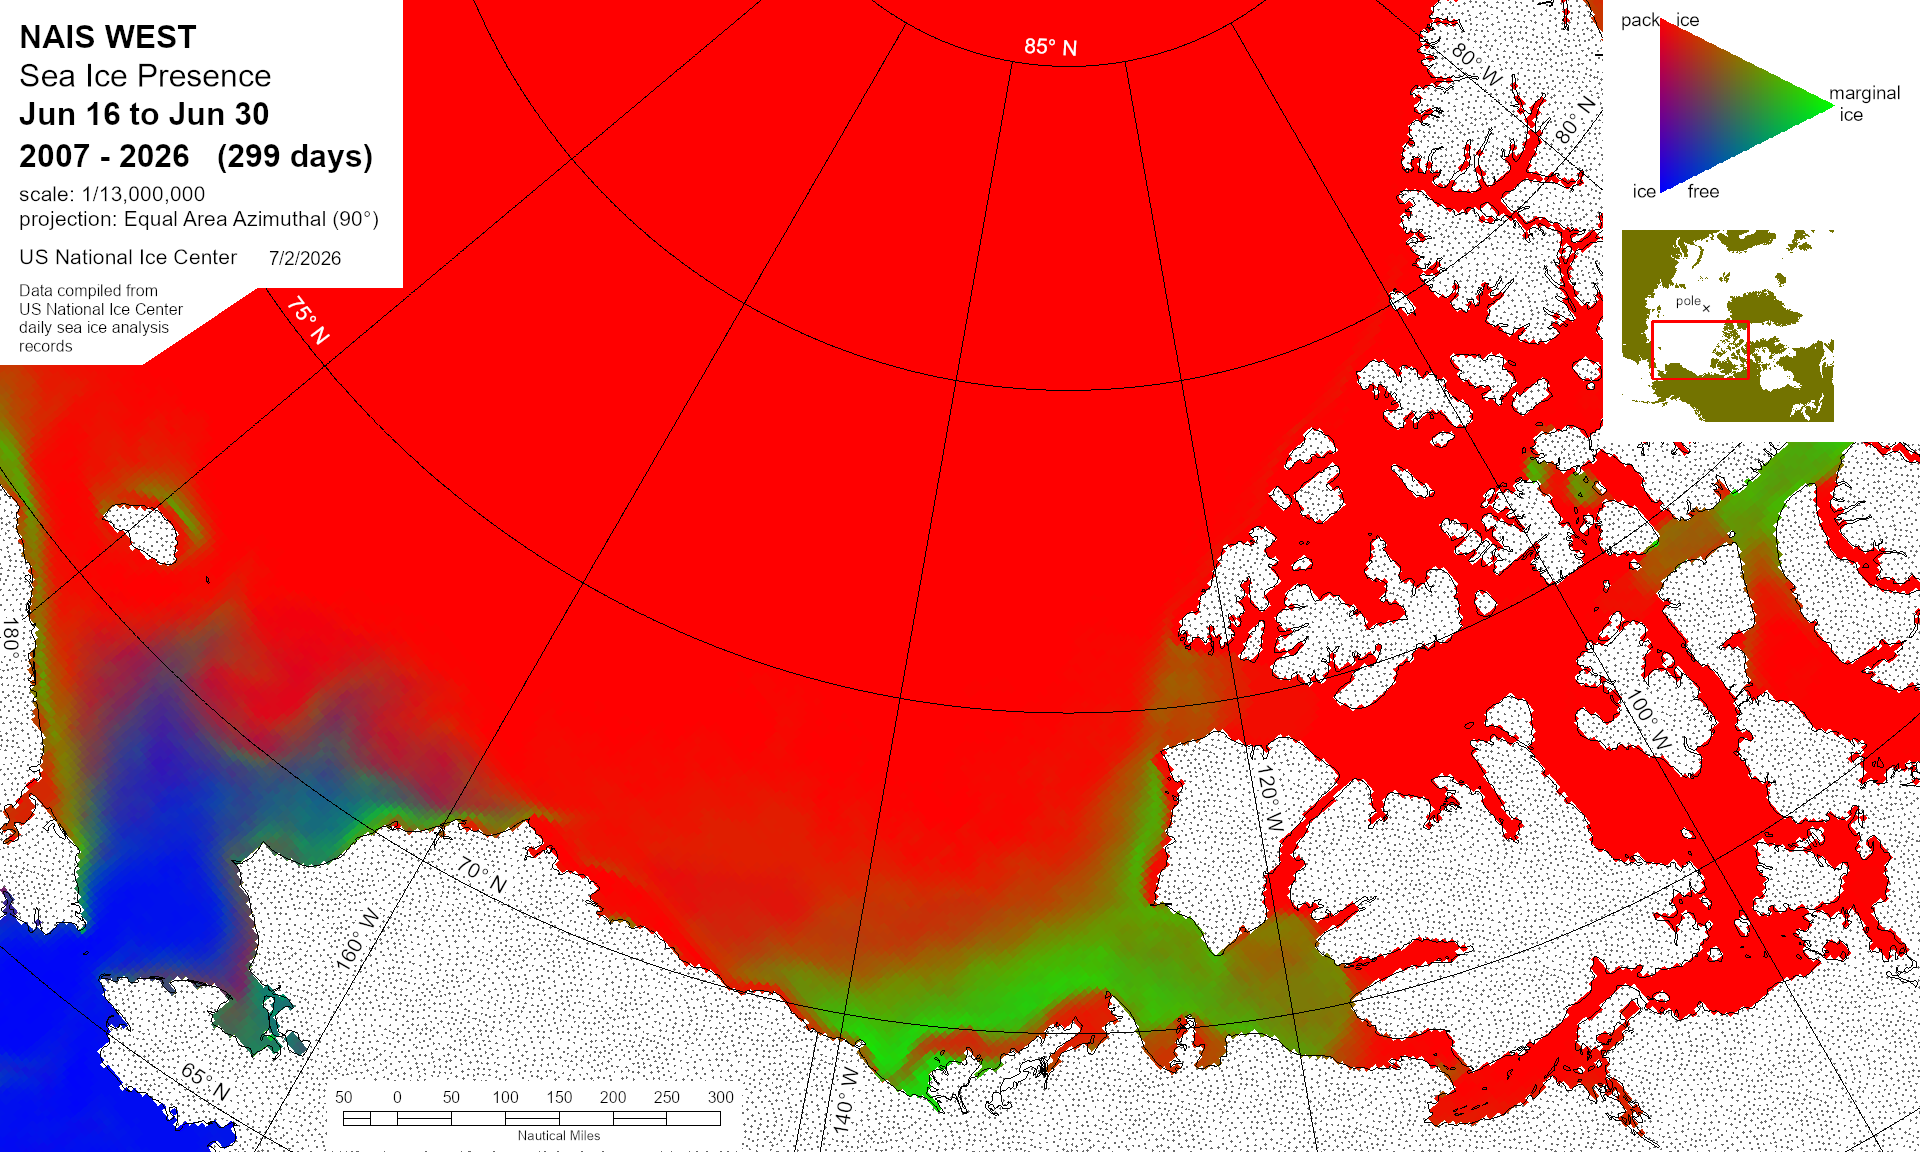
NAIS West Arctic Trivariate
Graphic representation of ice information gathered over a specified time that is contained within the NAIS Western Arctic boundaries.
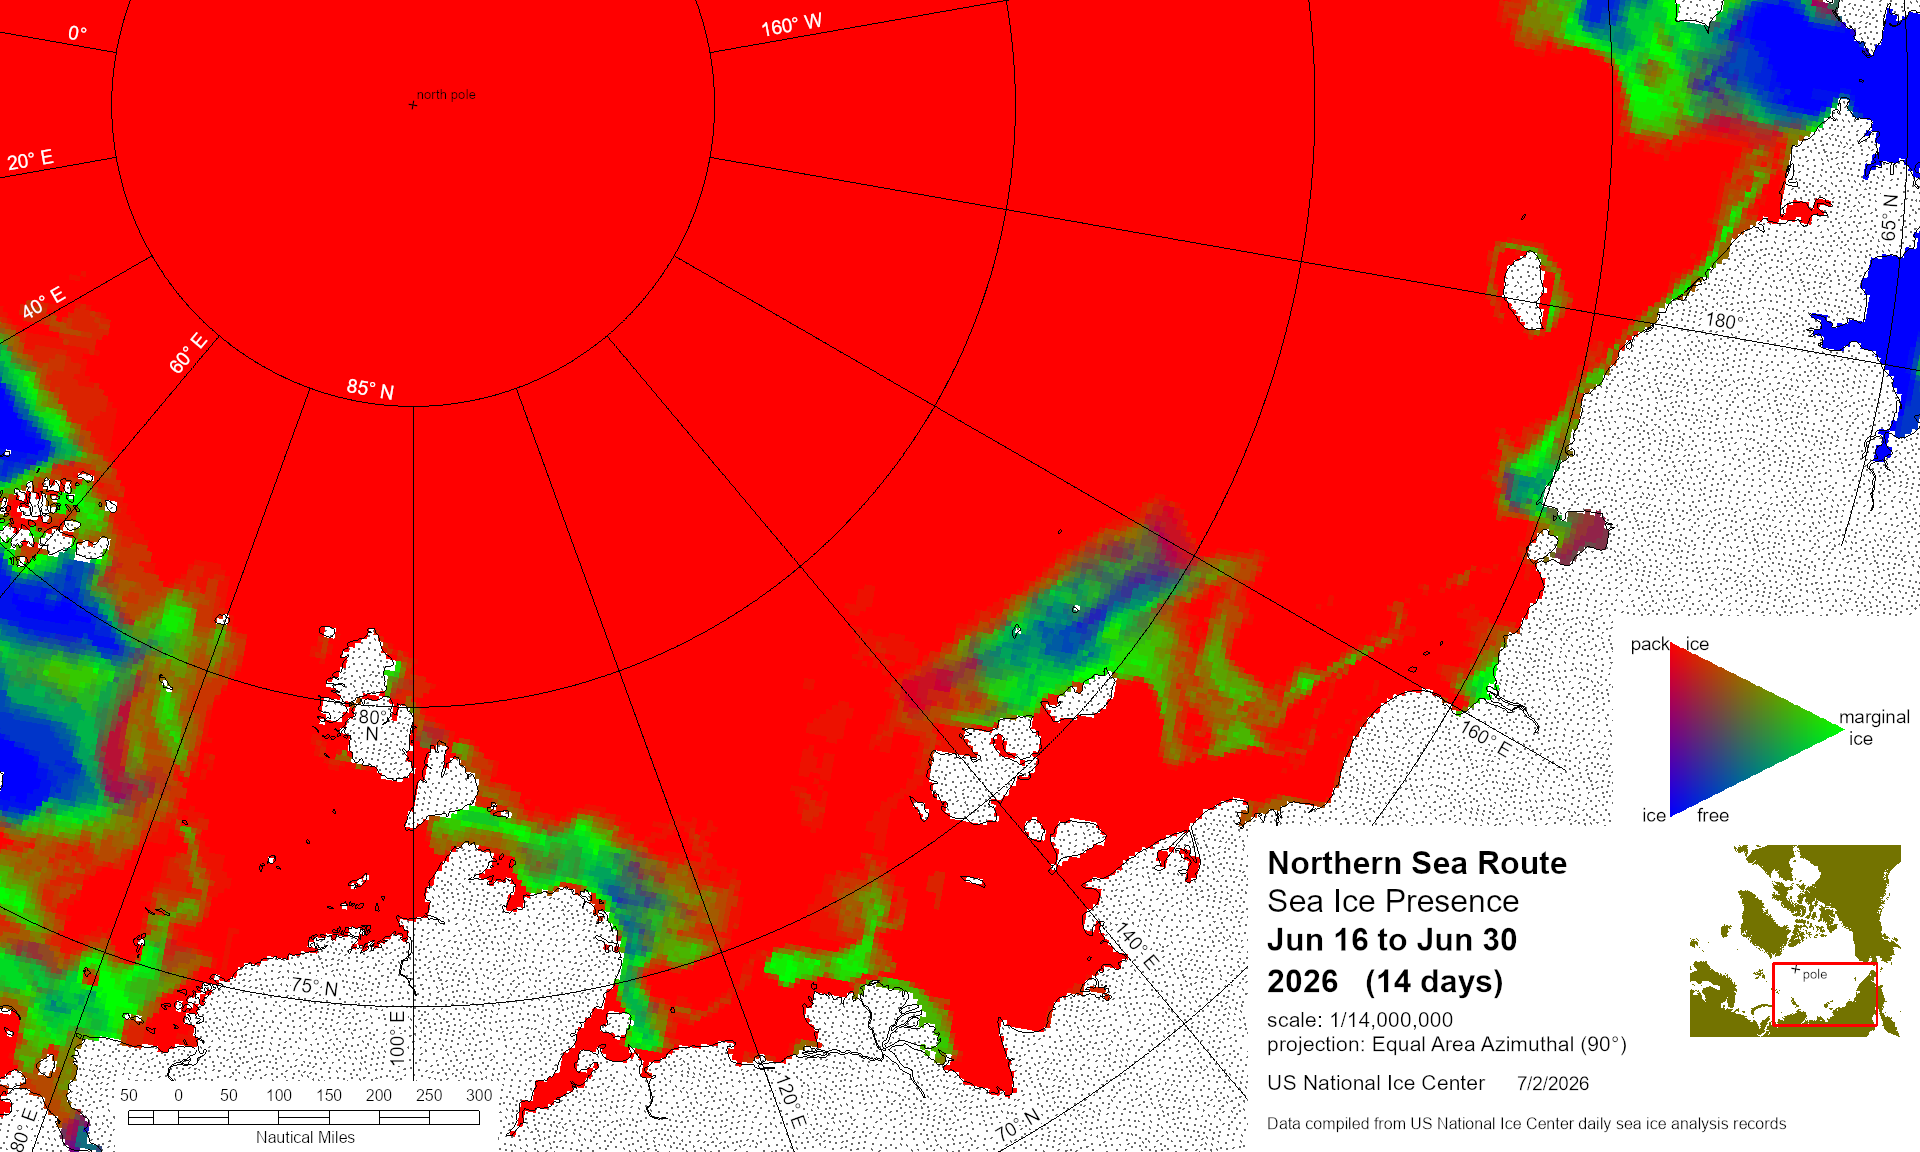
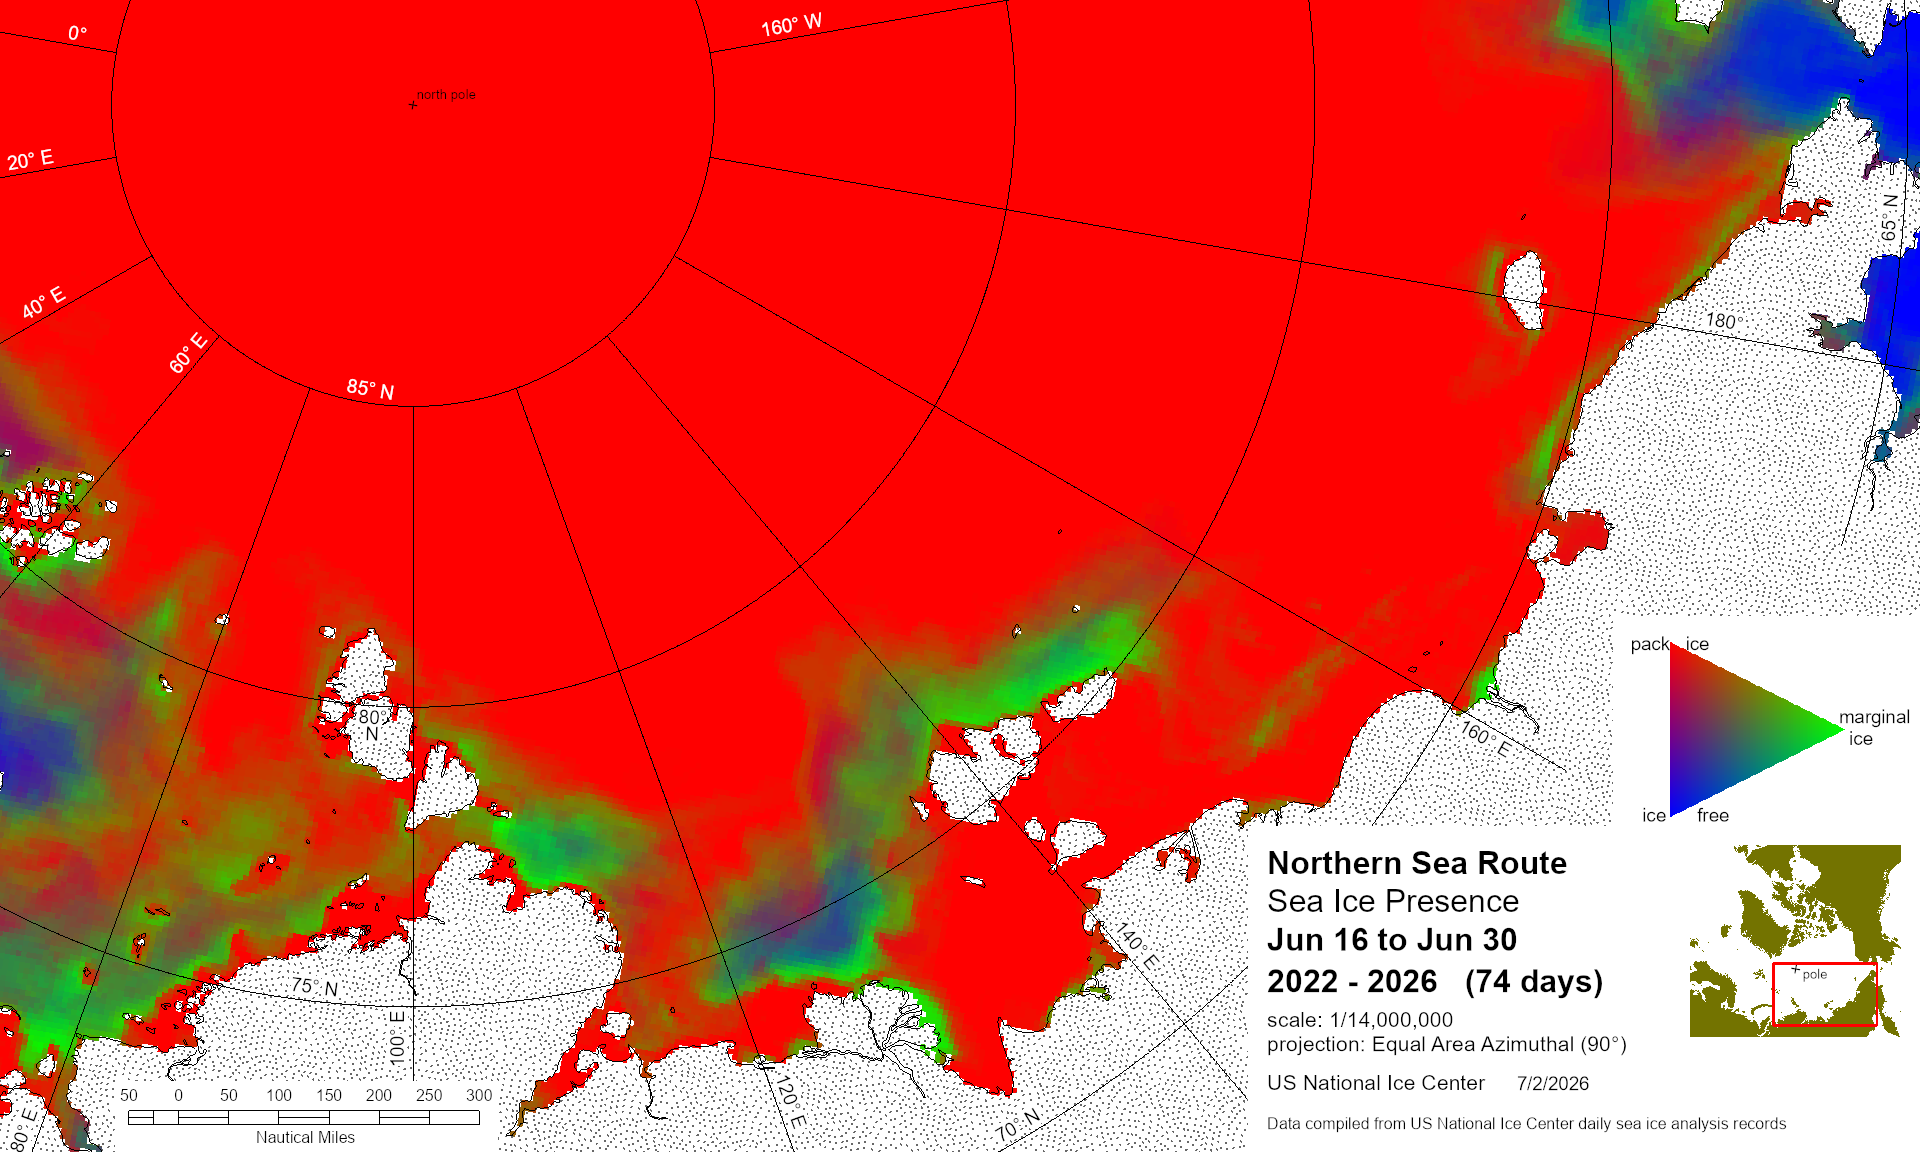
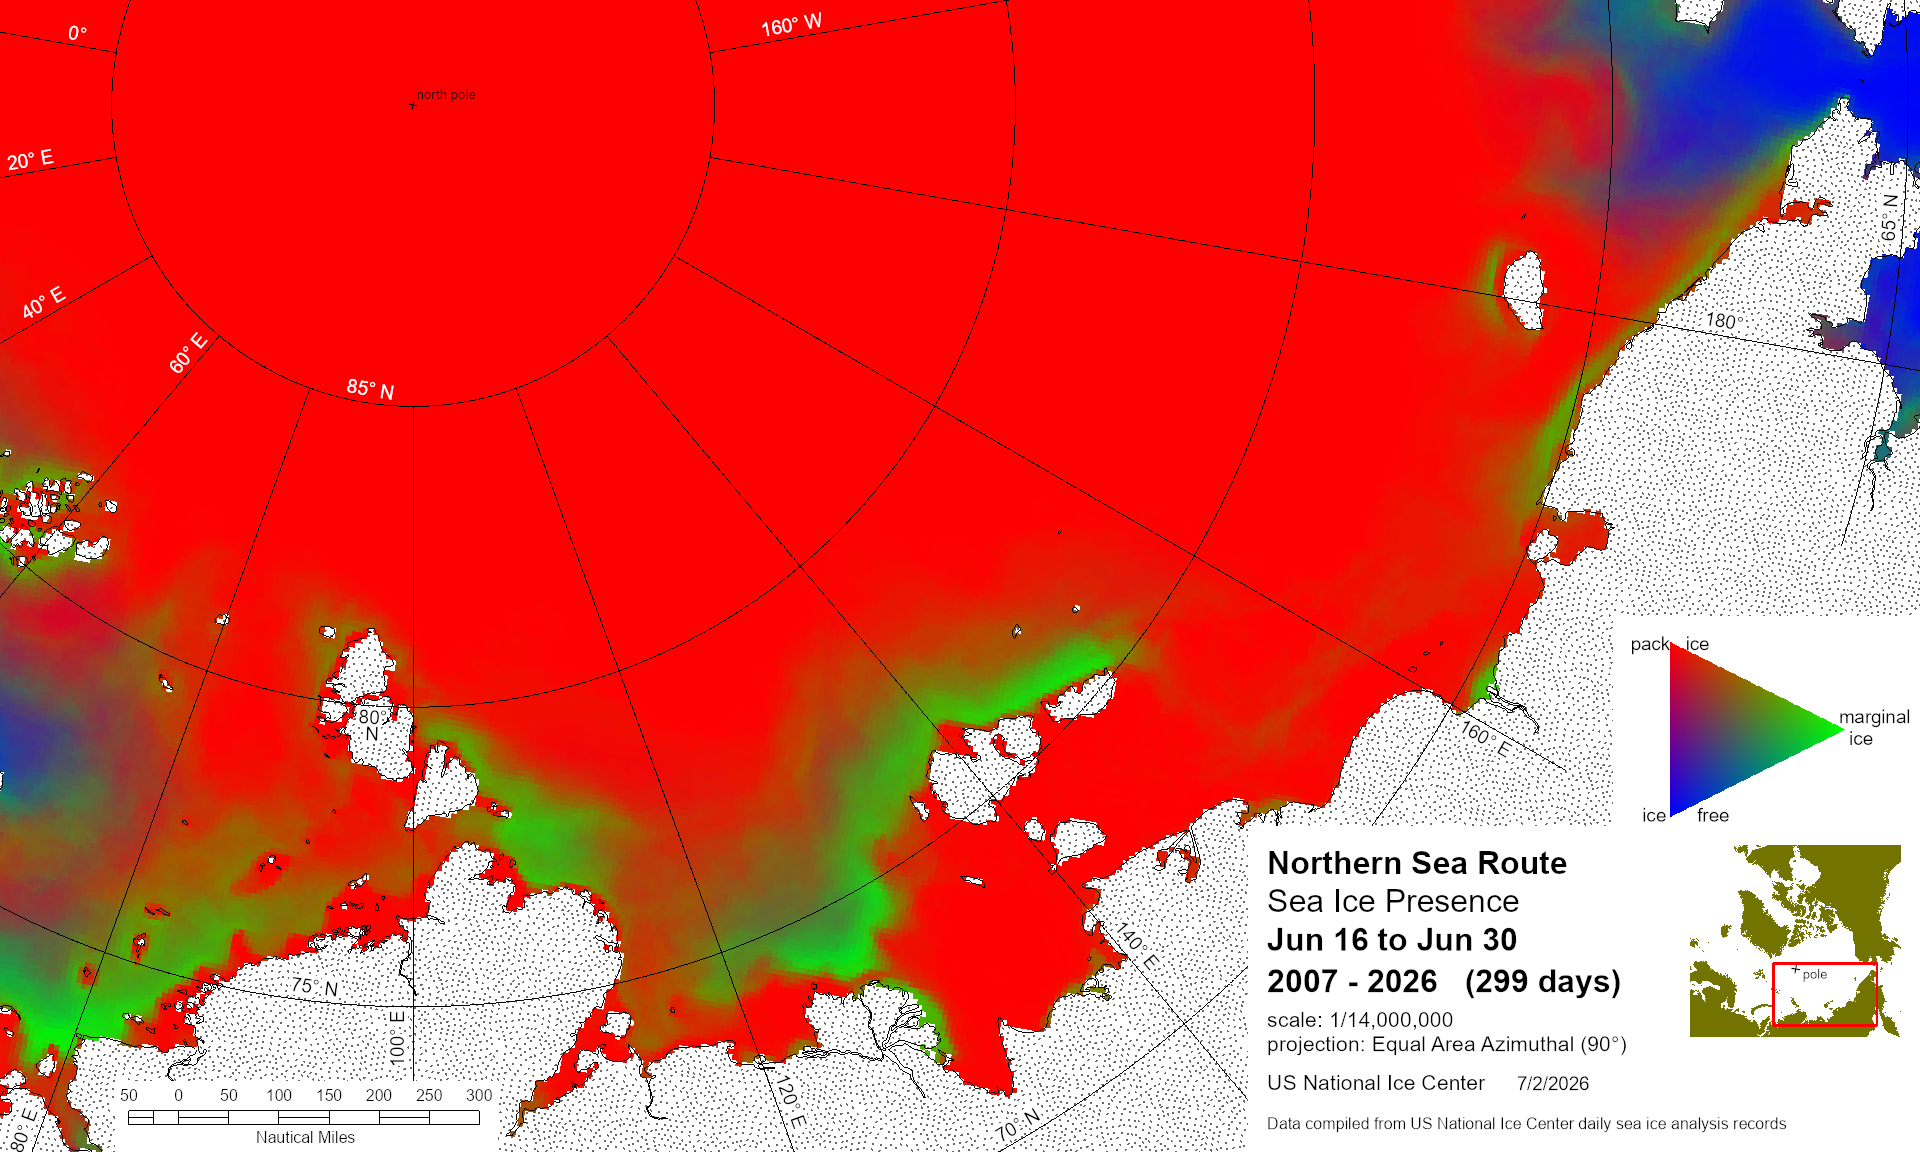
Northern Sea Route Trivariate
Graphic representation of ice information gathered over a specified time that is contained within the Northern Sea Route path.
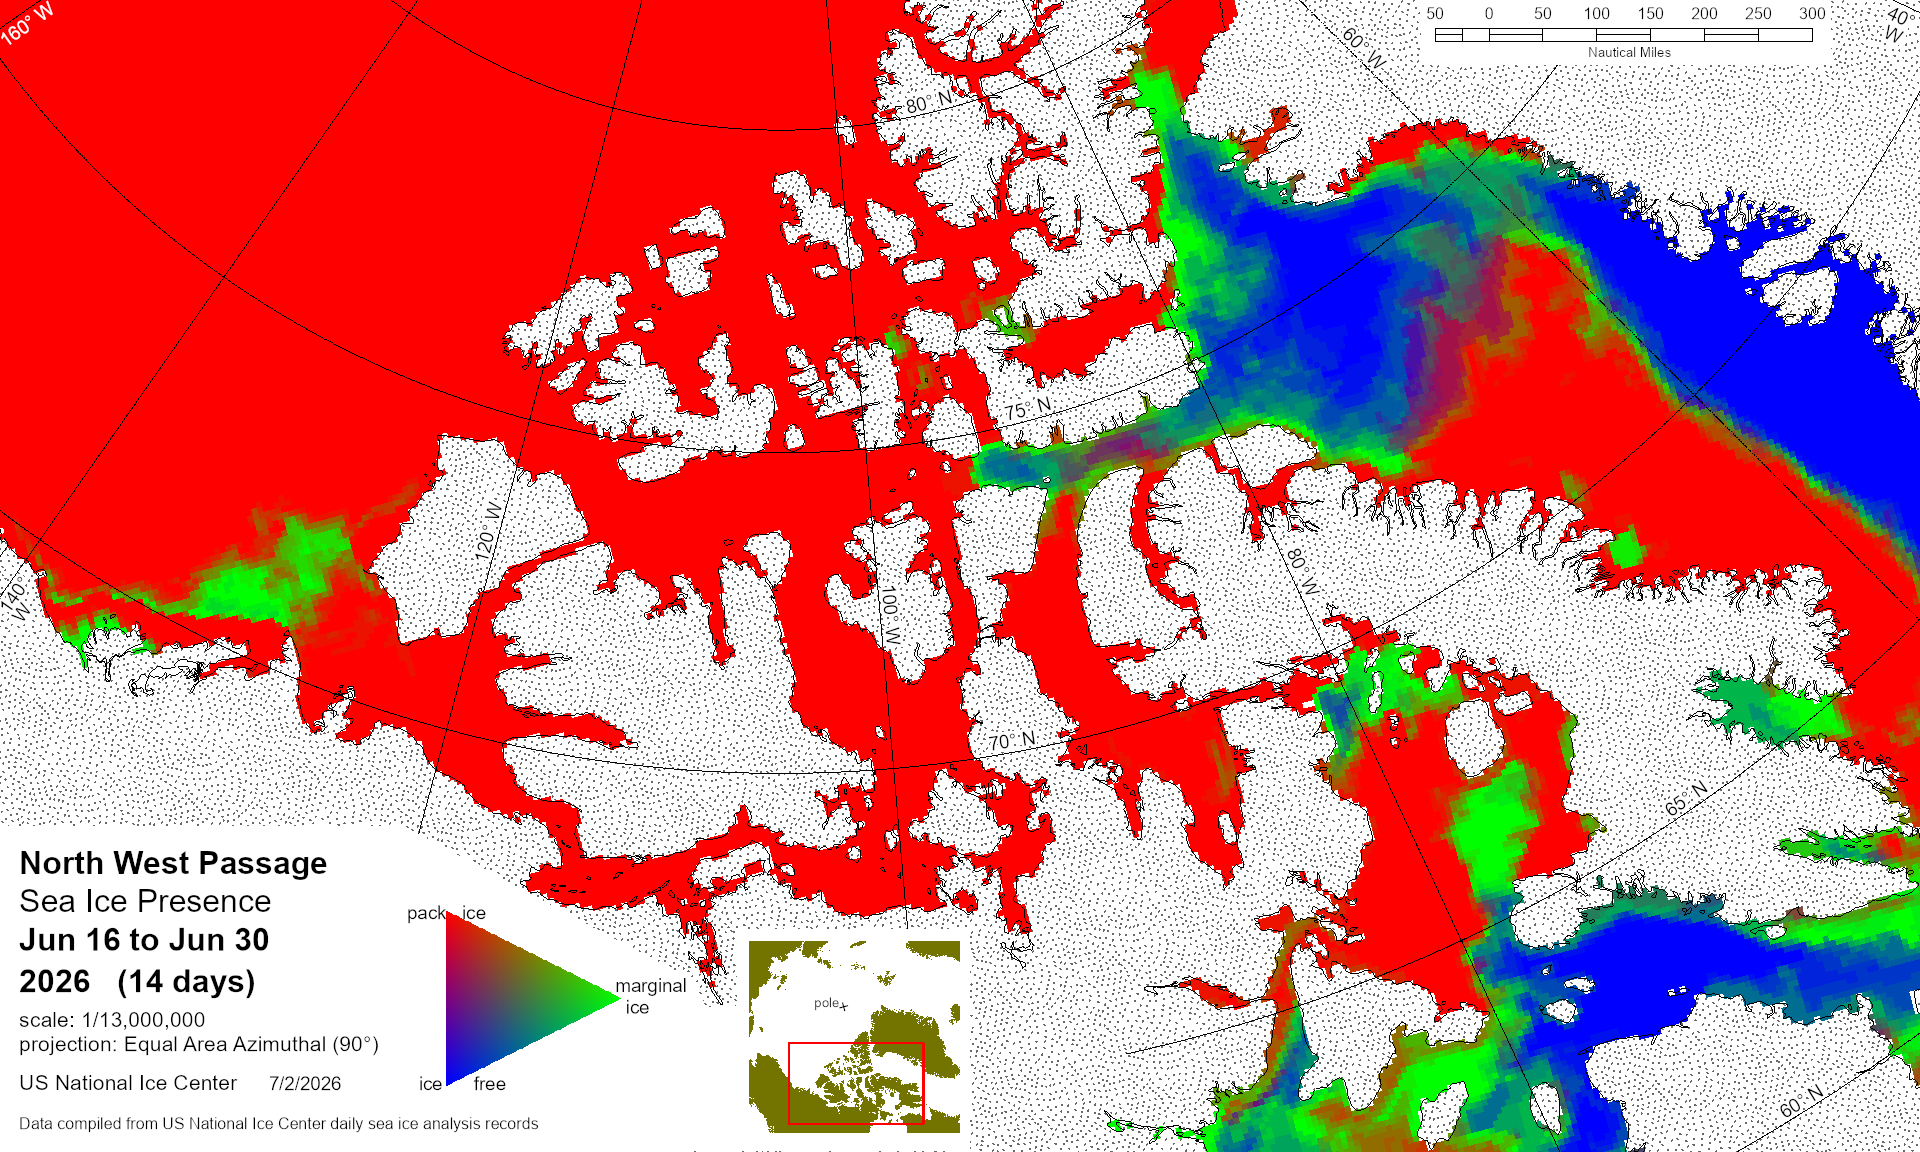
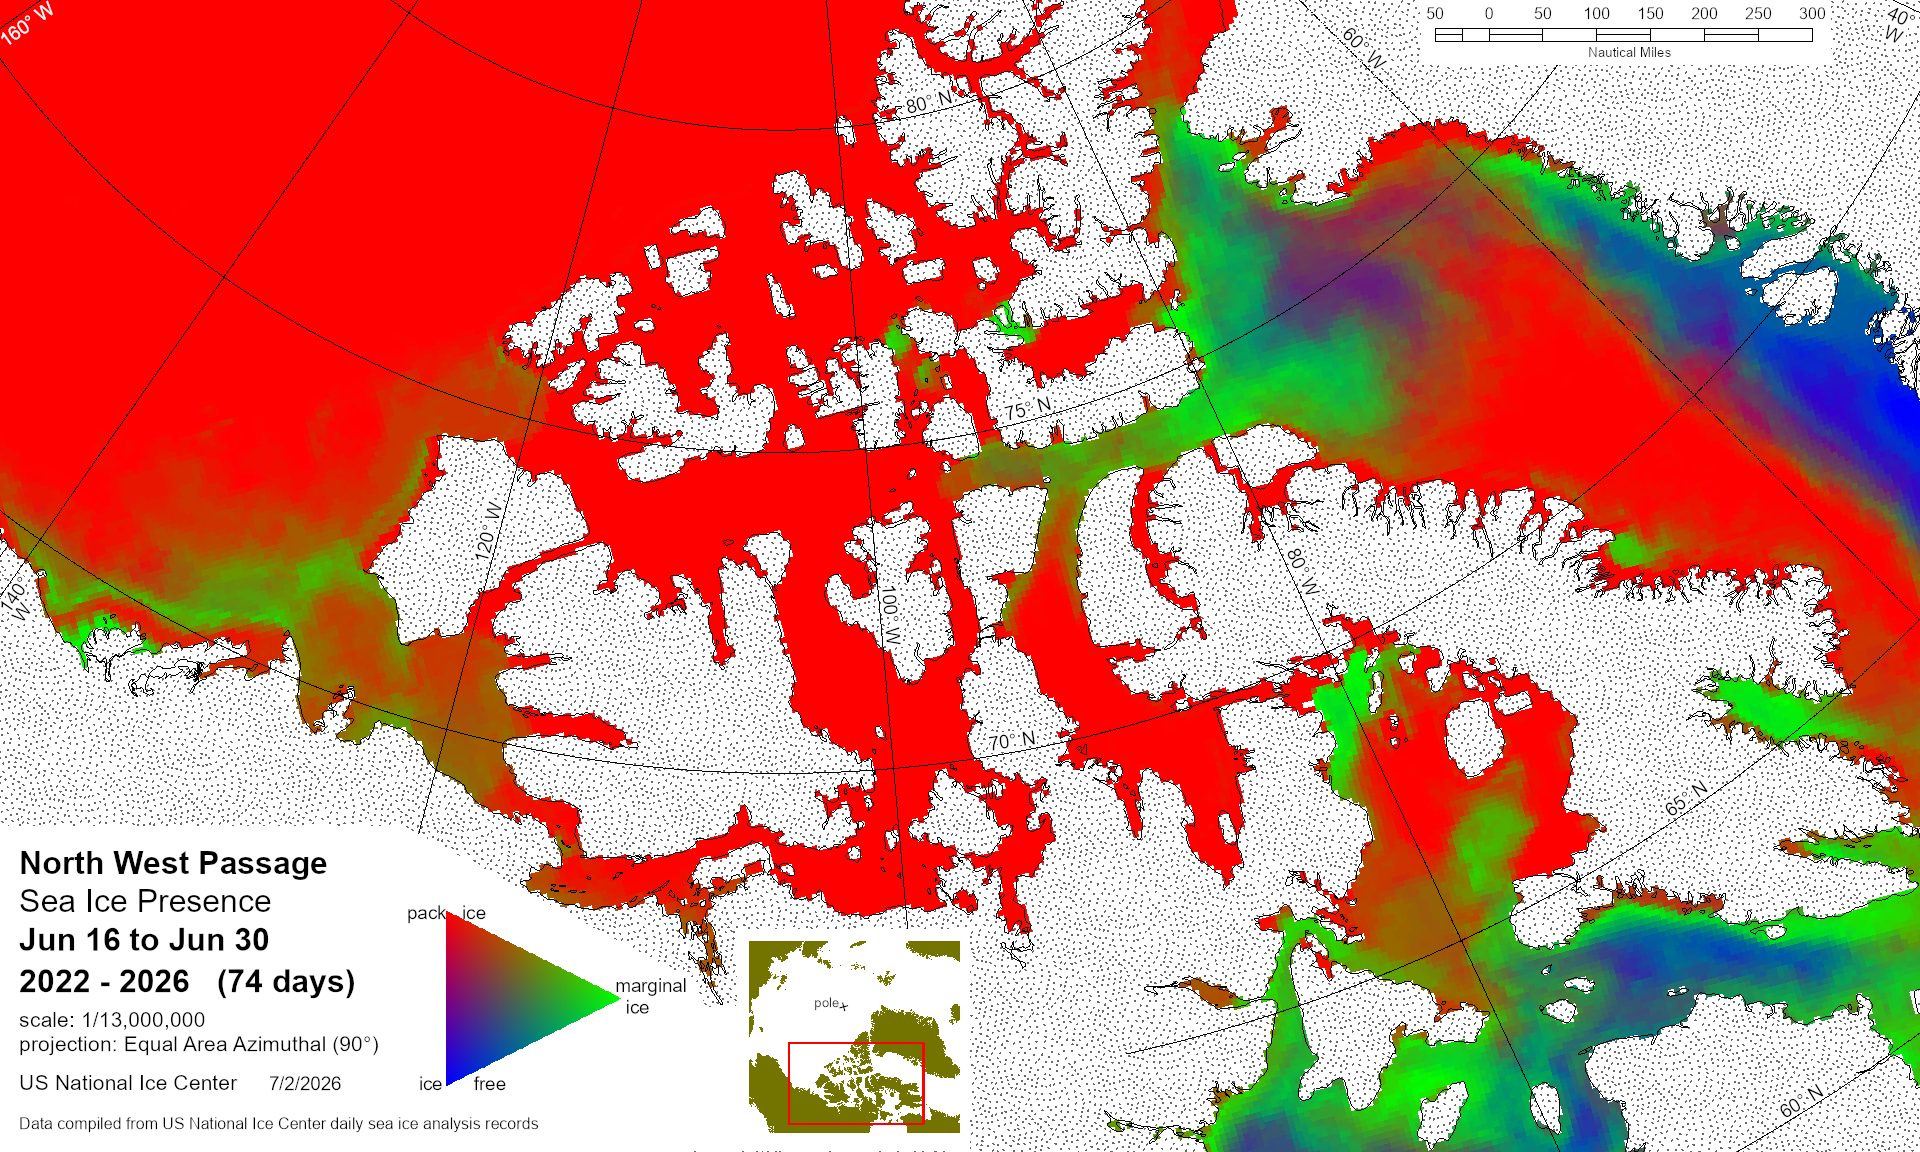
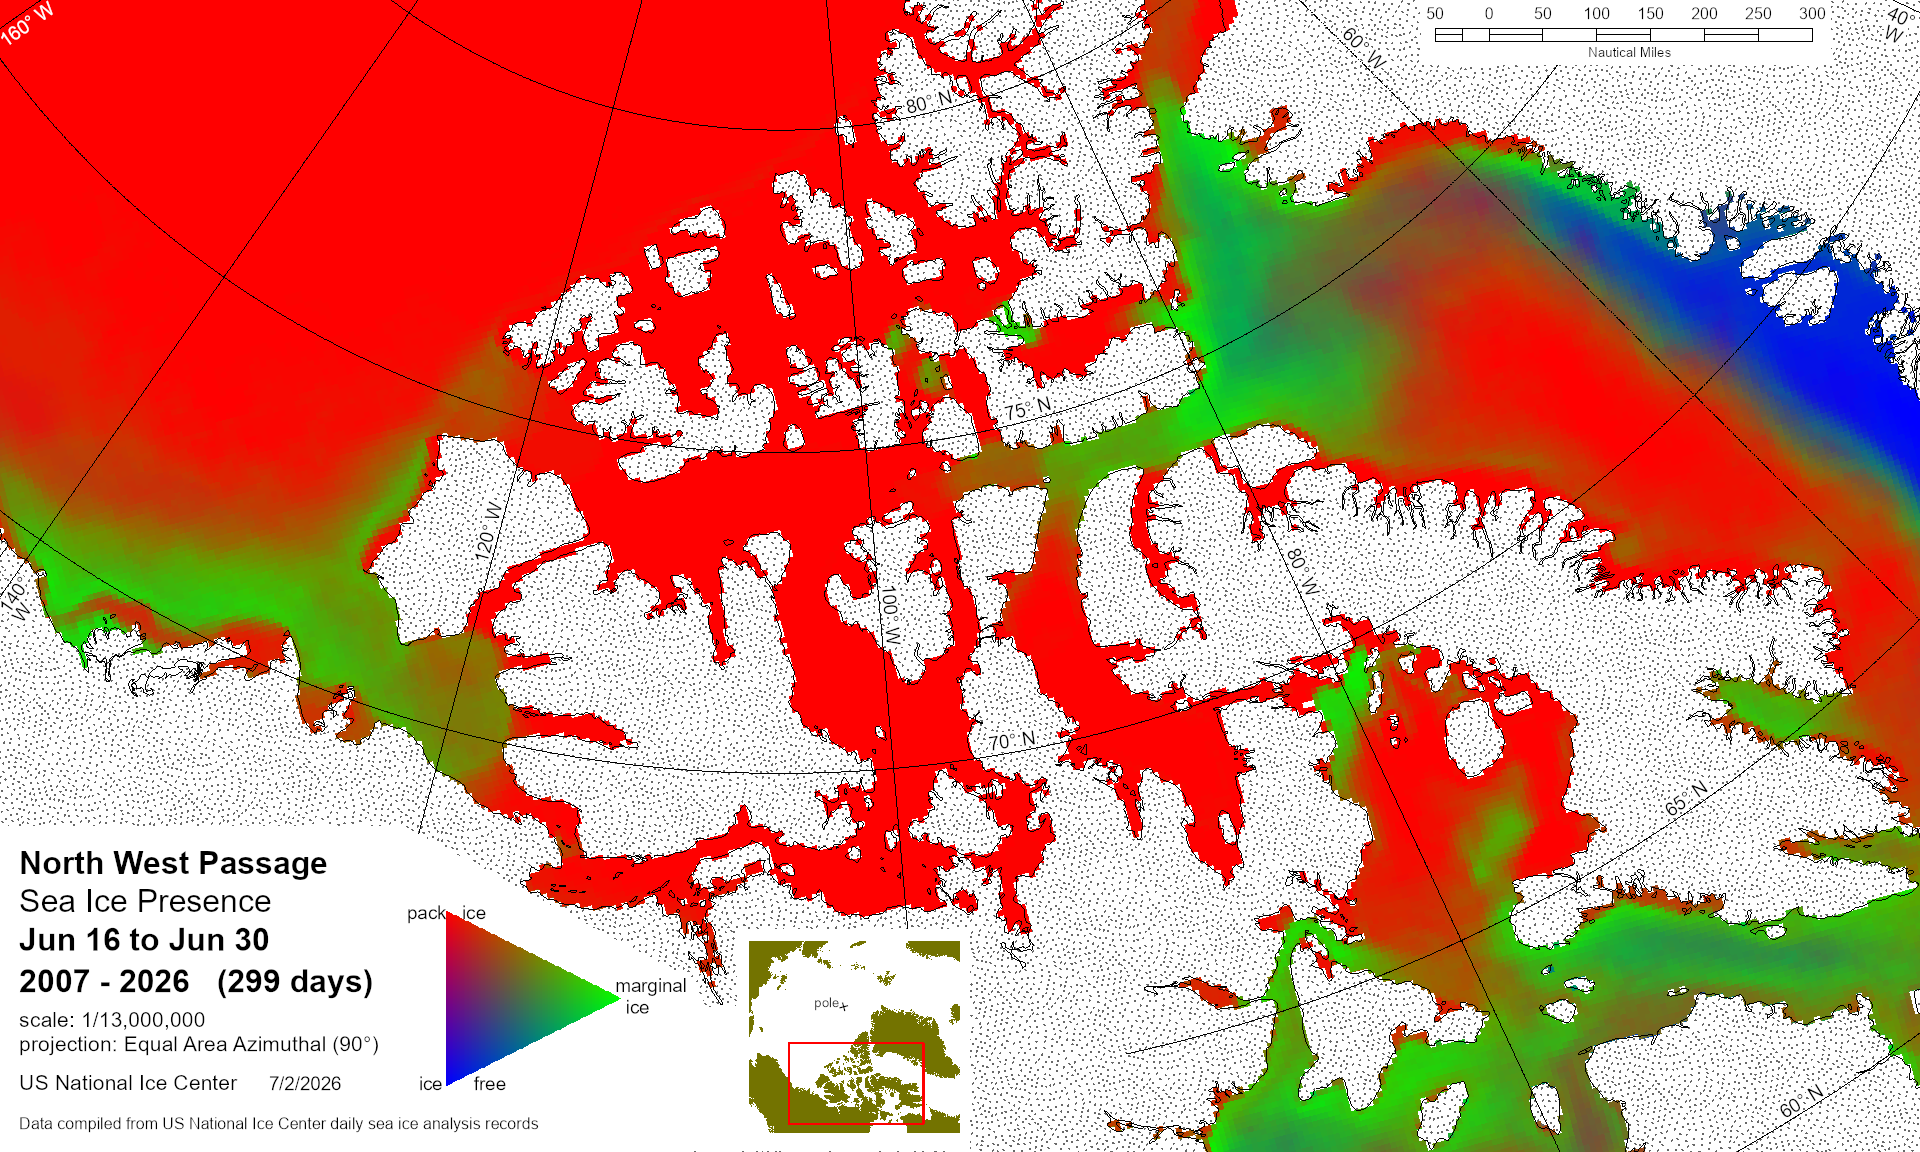
Northwest Passage Trivariate
Graphic representation of ice information gathered over a specified time that is contained along the Northwest Passage region.
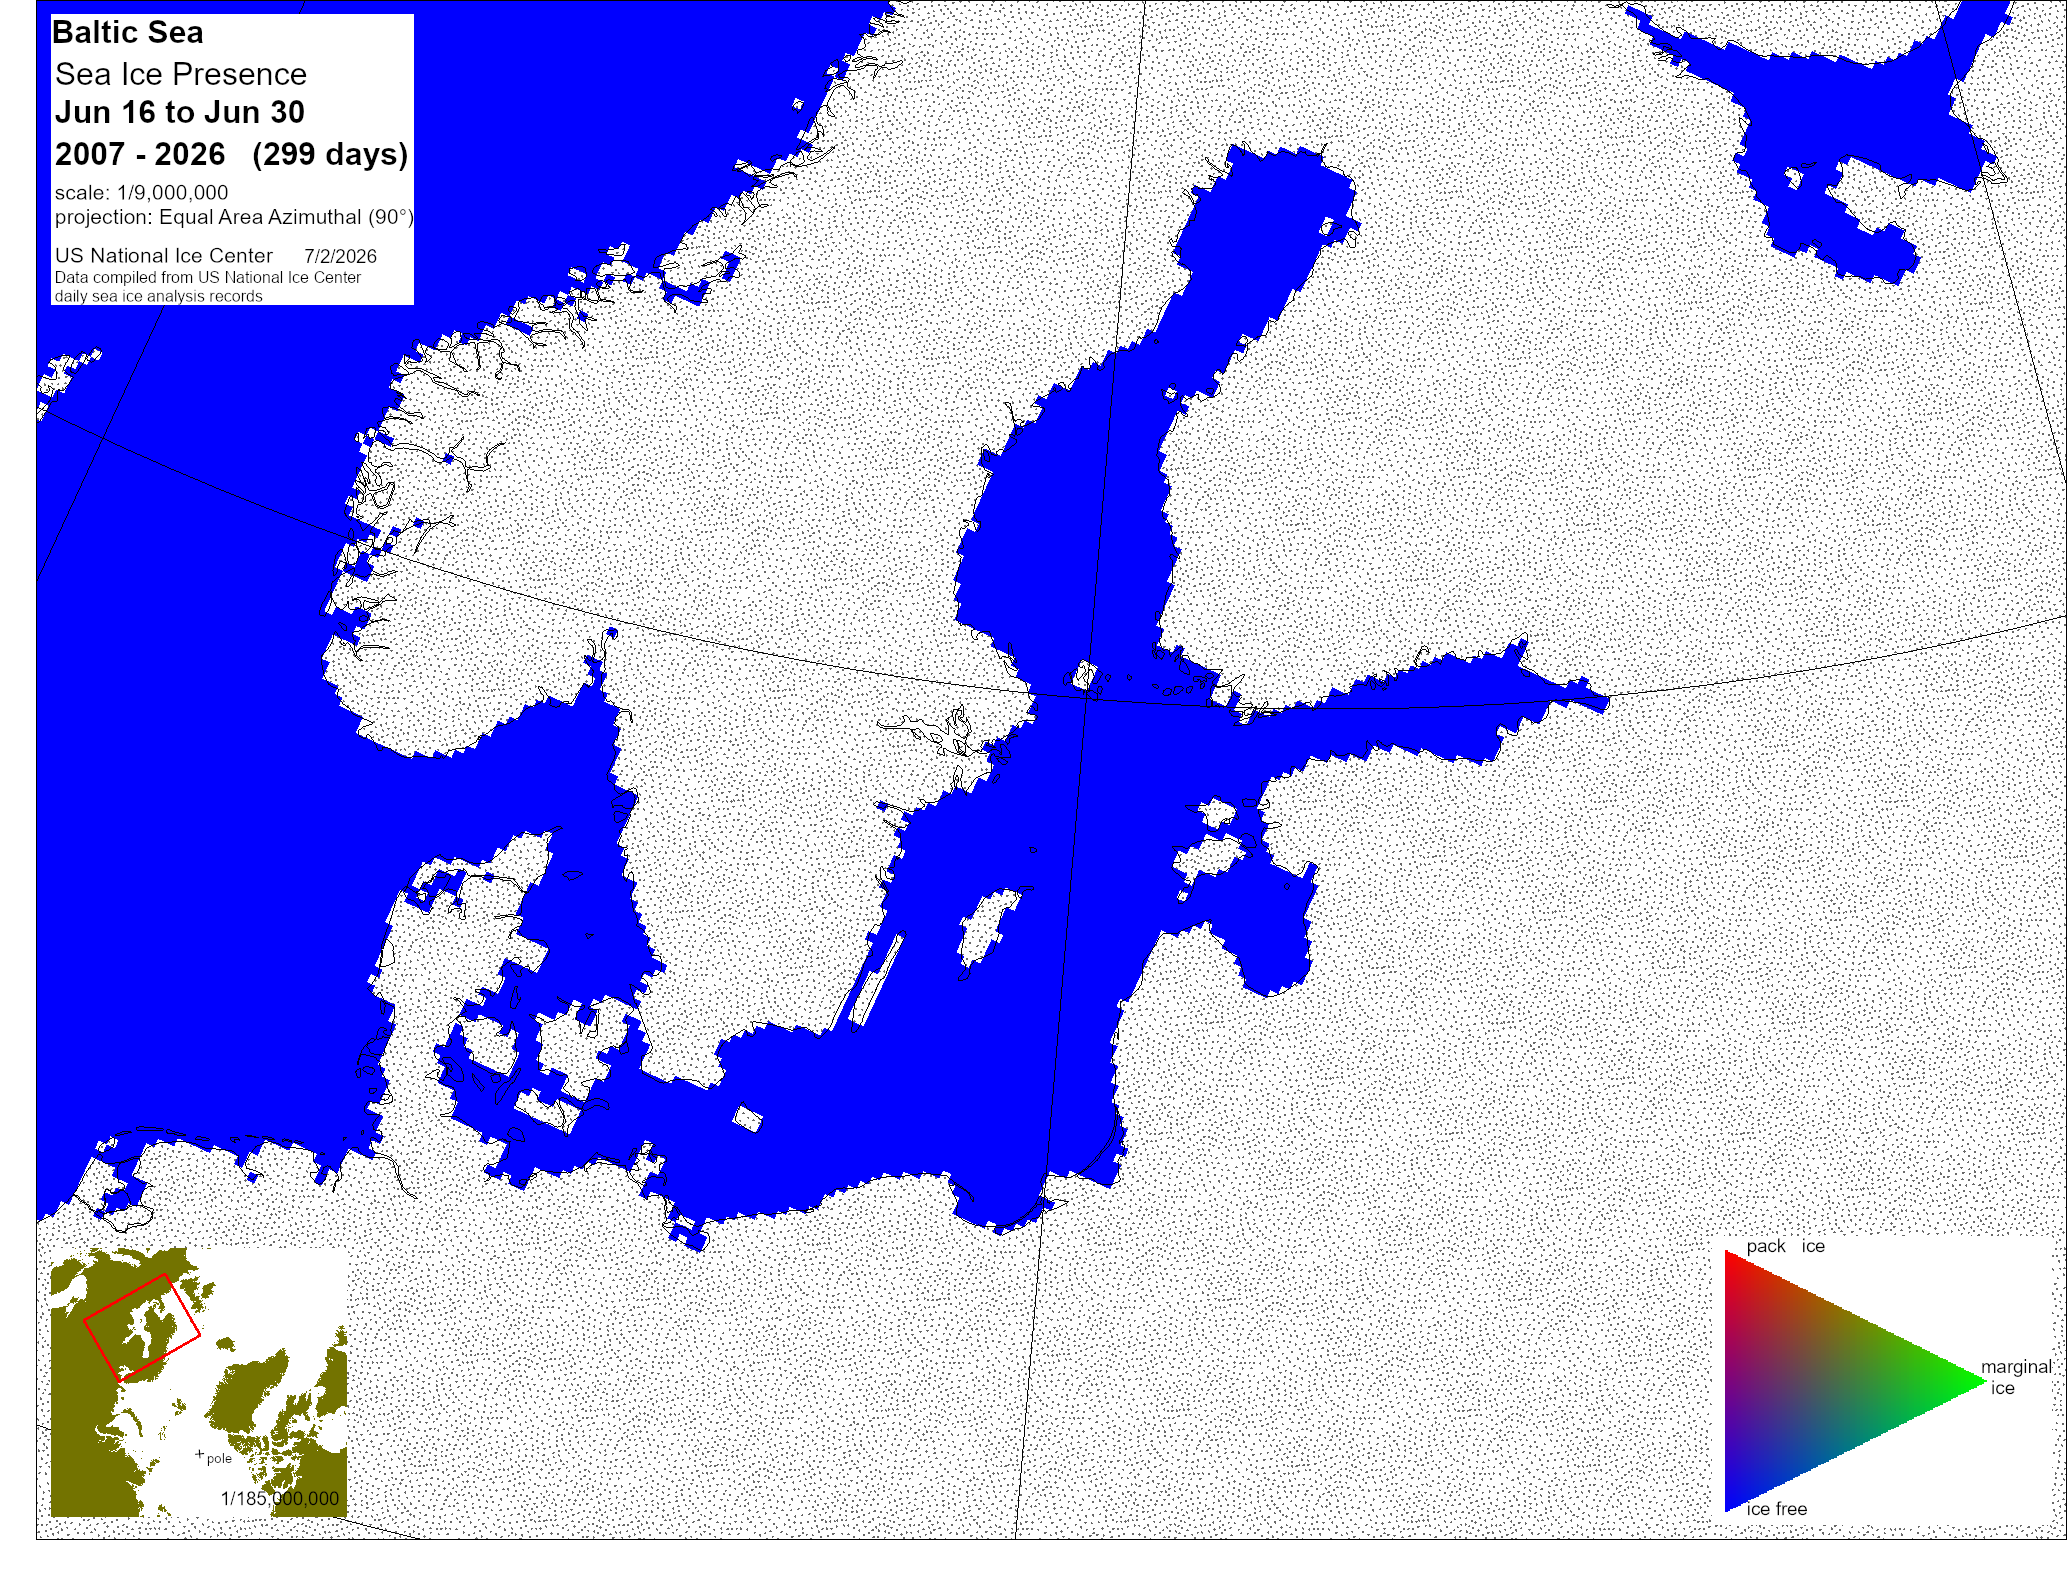
Baltic Sea Trivariate
Graphic representation of ice information gathered over a specified time that is contained along the Baltic region.
Bering Sea Trivariate
Graphic representation of ice information gathered over a specified time that is contained along the Bering Sea region.
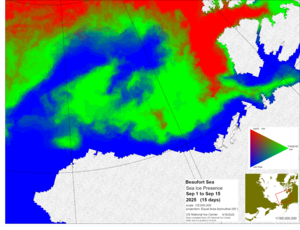
Beaufort Sea Trivariate
Graphic representation of ice information gathered over a specified time that is contained along the Beaufort Sea region.
Sea of Okhotsk Trivariate
Graphic representation of ice information gathered over a specified time that is contained along the Sea of Okhotsk path.
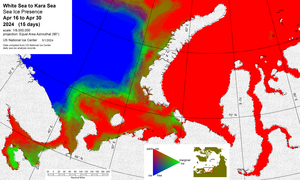
White Sea - Kara Sea Trivariate
Graphic representation of ice information gathered over a specified time that is contained along the White Sea - Kara Sea region.
Yellow Sea Trivariate
Graphic representation of ice information gathered over a specified time that is contained along the Yellow Sea region.