IMS Periodic Support Files
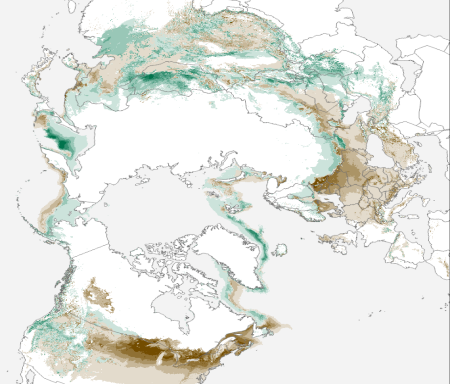
Twice monthly graphic of departure from normal of days of snow and ice cover on the surface, with normal defined as 2006-2023 compared against the average number of days snow or ice is present in a grid cell of IMS for the indicated half month period..
Area
Description
Display / Format
Departure from Normal Charts
Twice monthly graphic representation of departure from normal for days of snow and ice cover on the surface. The normal period is 2006-2023 for a period of record of 17 years, defined as the average number of days of snow or ice present in a grid cell in IMS for an indicated half month period. Areas of green depict areas with a surplus of days of snow or ice present, while the areas of brown depict areas with a deficit of snow or ice present during the indicated half month period.