Catalog Overview
Arctic Region
Antarctic Region
Great Lakes Region
Mid-Atlantic Region
Antarctic 30-Day Ice Extent Change Chart
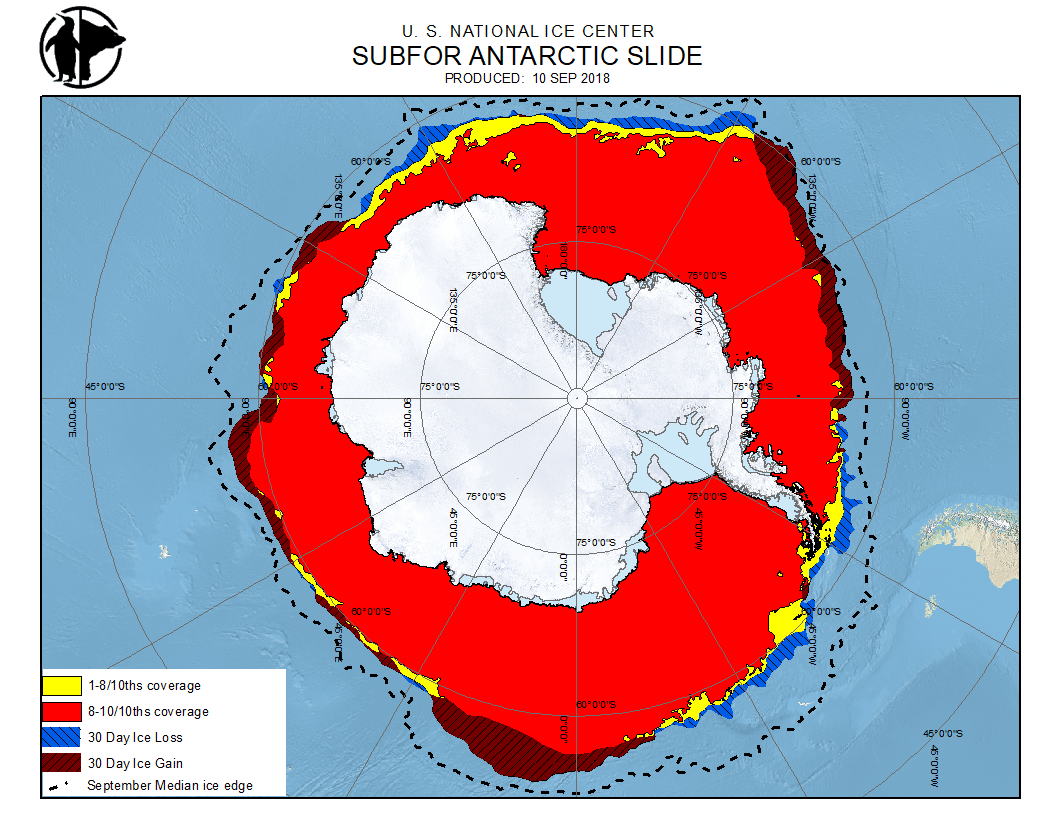
Product: 30-Day Ice Extent Change Chart
Description: A graphical representation of the change in sea ice extent over the last 30 days
Coverage Area: Antarctic waters
Format: PNG
Periodicity: Weekly on Friday
Dissemination: USNIC website, CTG 80.7 Portal, NEP-Oc IC Portal